Universal High Income
 OnlyAgent
 Pearl
 Quantus
 Aerodrome Finance
 NEAR Protocol
 Lighter

- NEAR shows a bounce from the support mark of $1.500.
- Bulls willing to extend the gains beyond the neckline of $2.00
Near protocol price was gaining momentum and bounced in the last trading session. Moreover, bulls fetch the 20-day EMA and attempt to escape the congestion zone.
Moreover, the bullish candle formed in the last trading session shows the strength of bulls, which begins the reversal. Moreover, Near Price was under the correction phase from the previous months and tried to recover the gains by stretching the muscles. However, bulls have attained a grip and stayed in the congestion zone. However, the mighty bears maintained a hold near the supply mark of $2.00.
The recent rebound shows that bulls are trying to change the ongoing price trend from neutral to bullish. The reversal attained by bulls was at an exciting stage where NEAR was on the verge of breaking the neckline of the double bottom pattern.
The trajectory swings suggest a near-term hurdle of $2.00, which was the robust supply range to retest by bulls in the upcoming sessions.
Moreover, the chart shows a bullish pennant pattern broken earlier, but bulls could not crack the 200-day EMA and retraced toward the support zone.
When writing, Near protocol trades at $1.638 with an intraday gain of 2.92% showing bullish indications. Moreover, the pair of NEAR/BTC is at 0.000060 BTC, and the intraday trading volume was increased by 2.00% to $44.44 million. The day high of NEAR is $1.688, and the day low is $1.597. The market cap of NEAR is $1.01 billion.
Will NEAR attain momentum in next sessions?
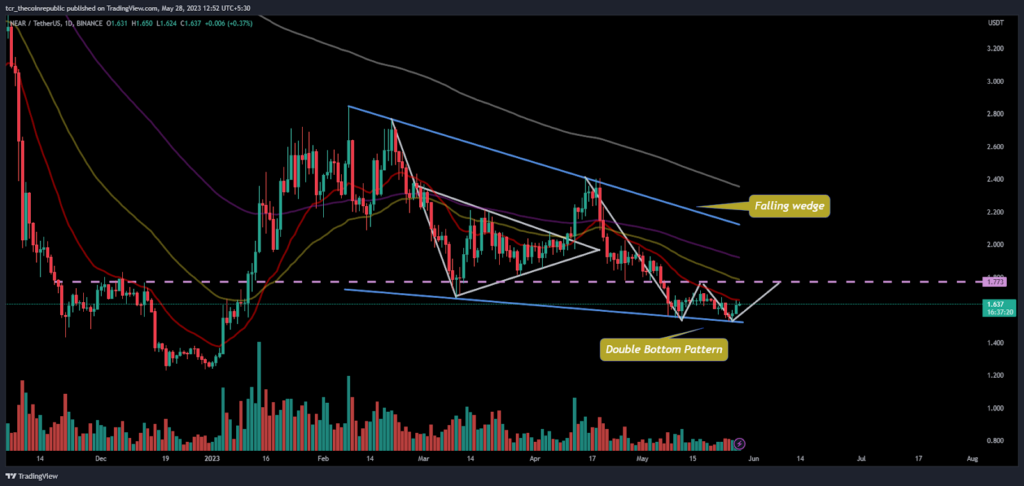
On the daily charts, the NEAR protocol shows multiple bullish patterns indicating positive cues. Furthermore, there was a correction that looked to an end, and bulls gradually accumulated the coin and started an up move.
The Fib levels indicate that the coin is near the 23.6% level. If bounced from there, further follow-up buying will lead to the pullback. Furthermore, there are multiple immediate hurdles that bulls will face to go above the bars.
What Technical Indicators Say?
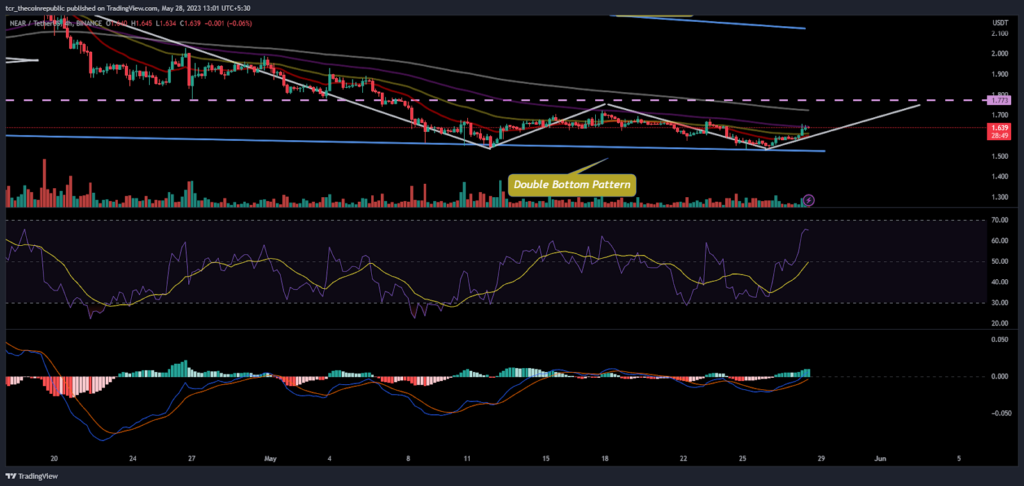
On the 4-hour charts, Near protocol price attained strength, and technical indicators showed bullishness on the charts. Moreover, further buying can be seen due to the short-covering move. The sellers were looking trapped and trying to exit their positions due to the bounce played by bulls.
The RSI sharply rose towards the overbought zone, and a positive crossover was noticed on the curve.
The MACD indicator showed a bullish crossover in the past trading sessions and floated green bars on the histogram.
Conclusion:
NEAR protocol fluctuated and stayed above the 20-day EMA, suggesting an upcoming bullish trend.
Technical levels;
Support Levels: $1.30
Resistance Levels:$1.90
Disclaimer
The views and opinions stated by the author, or any people named in this article, are for informational purposes only and do not establish financial, investment, or other advice. Investing in or trading crypto assets comes with a risk of financial loss.