
 Dacity Coin
 Injective
 NEAR Protocol
 Quantus
 Bitcoin
 Pearl
Pearl Sui
Sui
- DASH shows a morning star candle on the bottom.
- Bulls showing their intent and starts to accumulate the coin.
DASH coin showed headwinds and retested the base near $25 showing correction from the top. However, a morning star candle was formed which shows that a reversal play on there which gave advantage to bulls and they played it well after leading the reversal. Moreover, buying was noted in the last trading sessions indicating that bulls are pumping the gains and willing to reclaim the shine soon.
Recently, DASH showed a breakdown and broke its strong support mark of $35 where sellers gained momentum and led the breakdown towards $25, where the coin took a pause and a long legged bearish candle was formed. Afterwards instead of following on selling, a doji candle was formed followed by a hammer which reversed the selling sequence into a reversal.
Moreover, the price action shows a beginning of trend reversal and accumulation from the buyers, which if succeeds to surpass $35 and $40, then momentum will increase and buyers will lead the front. On the other hand, if any further down move happens, then the price will retest the base near $25.
When writing, DASH trades at $31.03 with an intraday drop of 0.07% showing neutral indications. Moreover, the pair of DASH/BTC is at 0.001171 BTC, and the intraday trading volume increased by 5.70% to $22.20 million. The day high of DASH is $31.46, and the day low is $30.78. The market cap of DASH is $342.80 Million.
Daily Chart Formation of DASH
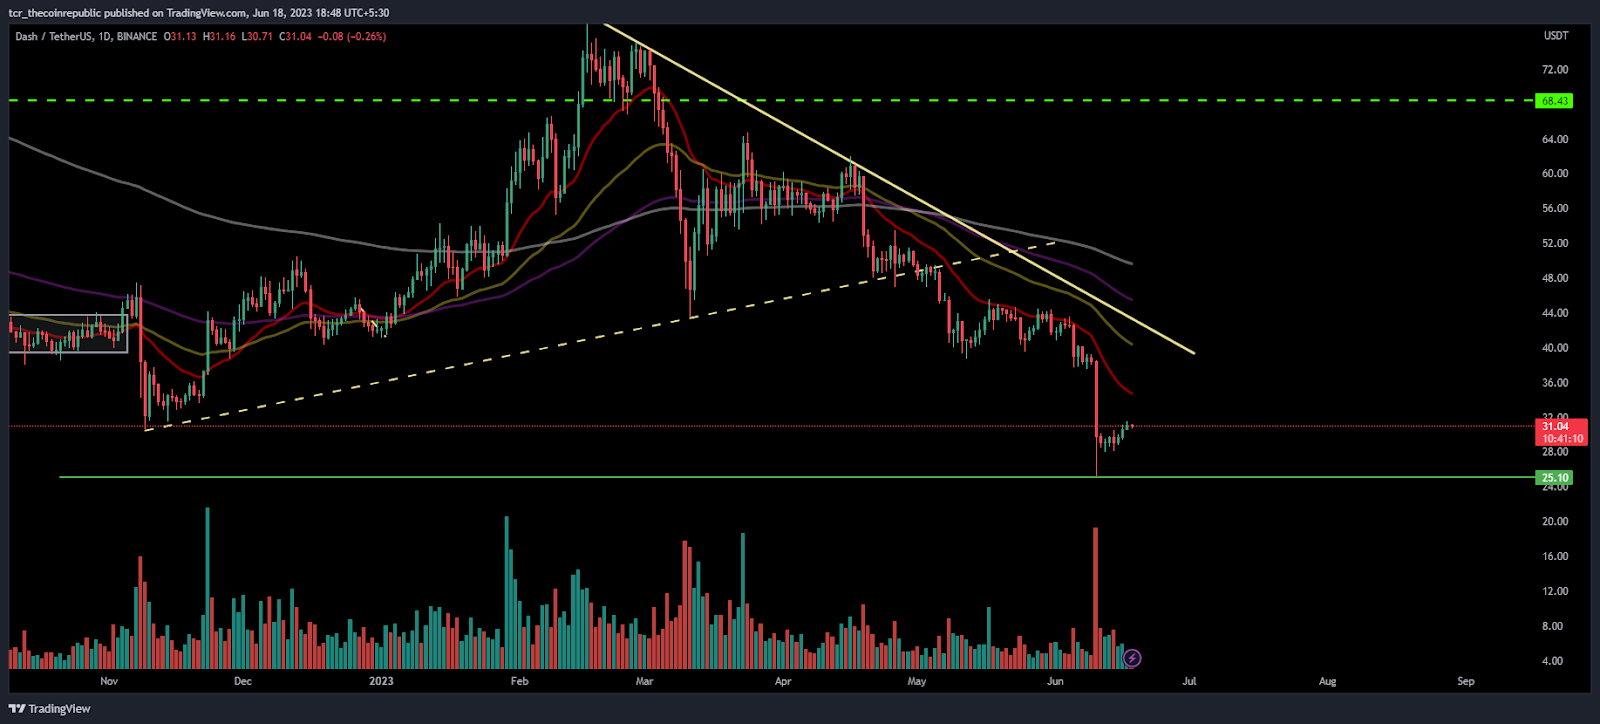
On the daily charts, the DASH coin was peeking a correction from the past trading sessions and sellers were showing their presence and dominating in the battle.
Moreover, the trajectory swings suggest that, if coin attains further bounce, then 20-day EMA near $35, acts as a resistance which, if surpassed, then bulls gain strength and acquire traction.
The ongoing trend shows that DASH has stayed near the bottom and holding the gains too long and now looking for a decisive move in the next sessions.
Moreover, the price is below the 23.6% Fib level, which buyers are willing to crack above the mark near $35.
Short term charts of DASH
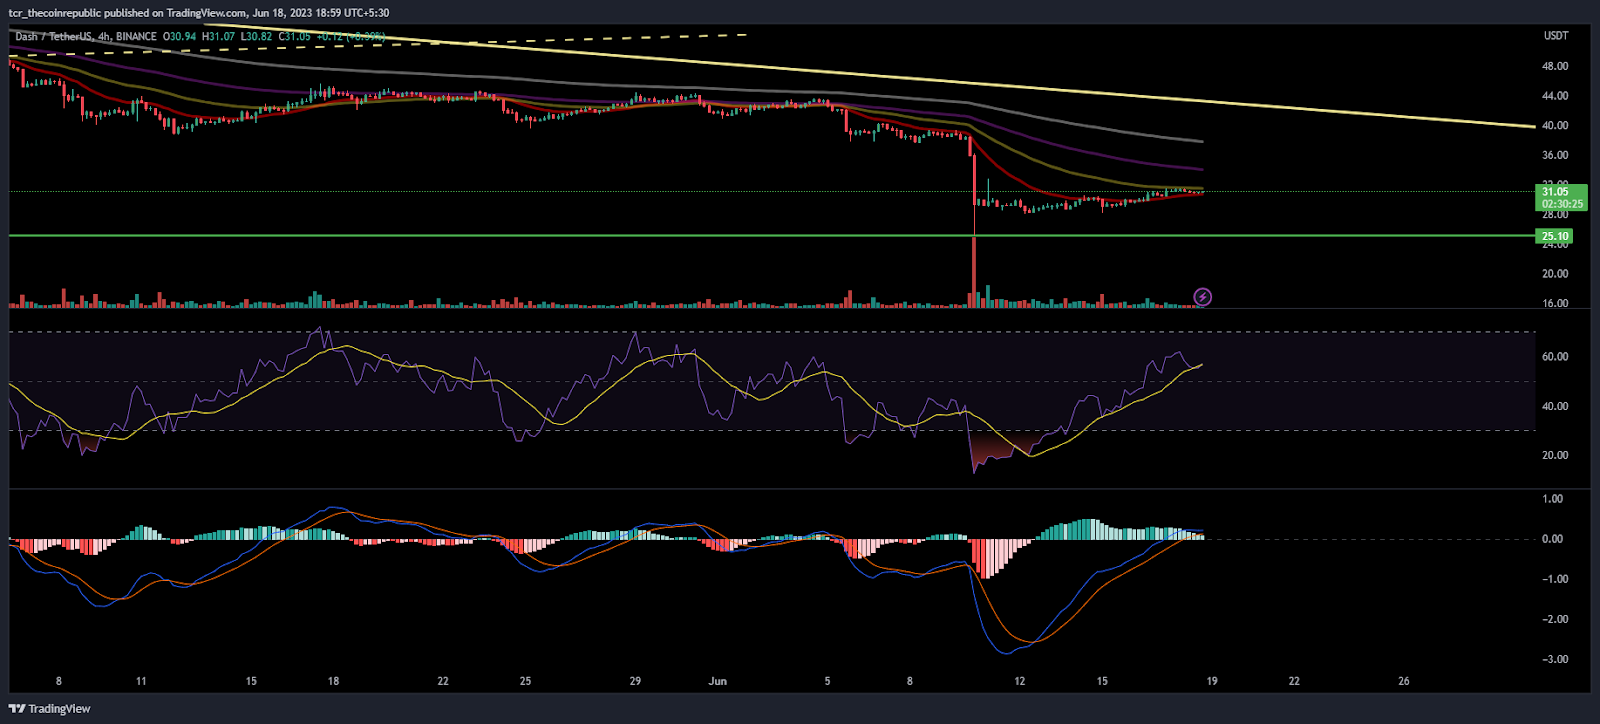
On the 4-hour charts, DASH showed a bounce from the base near $25 and waiting to follow on buying near $30 facing resistance on it.
The RSI is showing a massive bounce and an inclining move from the oversold region and starts to float above the neutral mark. The curve is near to 60 with a positive crossover.
The MACD curve shows a bullish crossover and starts to form green bars on the histogram showing a positive outlook.
Conclusion:
DASH coin is now looking to attain further strength and bulls are rescuing the muscles back and hoping for a reversal.
Technical Levels:
Support Levels: $25
Resistance Levels:$45
Disclaimer
The views and opinions stated by the author, or any people named in this article, are for informational purposes only and do not establish financial, investment, or other advice. Investing in or trading crypto assets comes with a risk of financial loss.




