
 Boomer
 Minter
 Pearl
Pearl Pudgy Penguins
 Sui
Sui Covenant x402
 Pump.fun
- Salesforce Inc.’s stock price is trading above 20,50 and 100-day EMA levels.
- Salesforce Inc.’s stock price is currently trading at $209.59.
- Salesforce Inc. (CRM)’s live market cap is $204.14 Billion.
A significant provider of cloud-based software with its headquarters in San Francisco, California, the United States, is Salesforce.com, Inc., also known as Salesforce. Salesforce, a company that was founded in 1999, is well known for its customer relationship management (CRM) platform and a variety of business software solutions. Salesforce provides a full range of cloud-based applications that make it easier for businesses to manage their sales, marketing, customer support, and other company processes
Trend Analysis
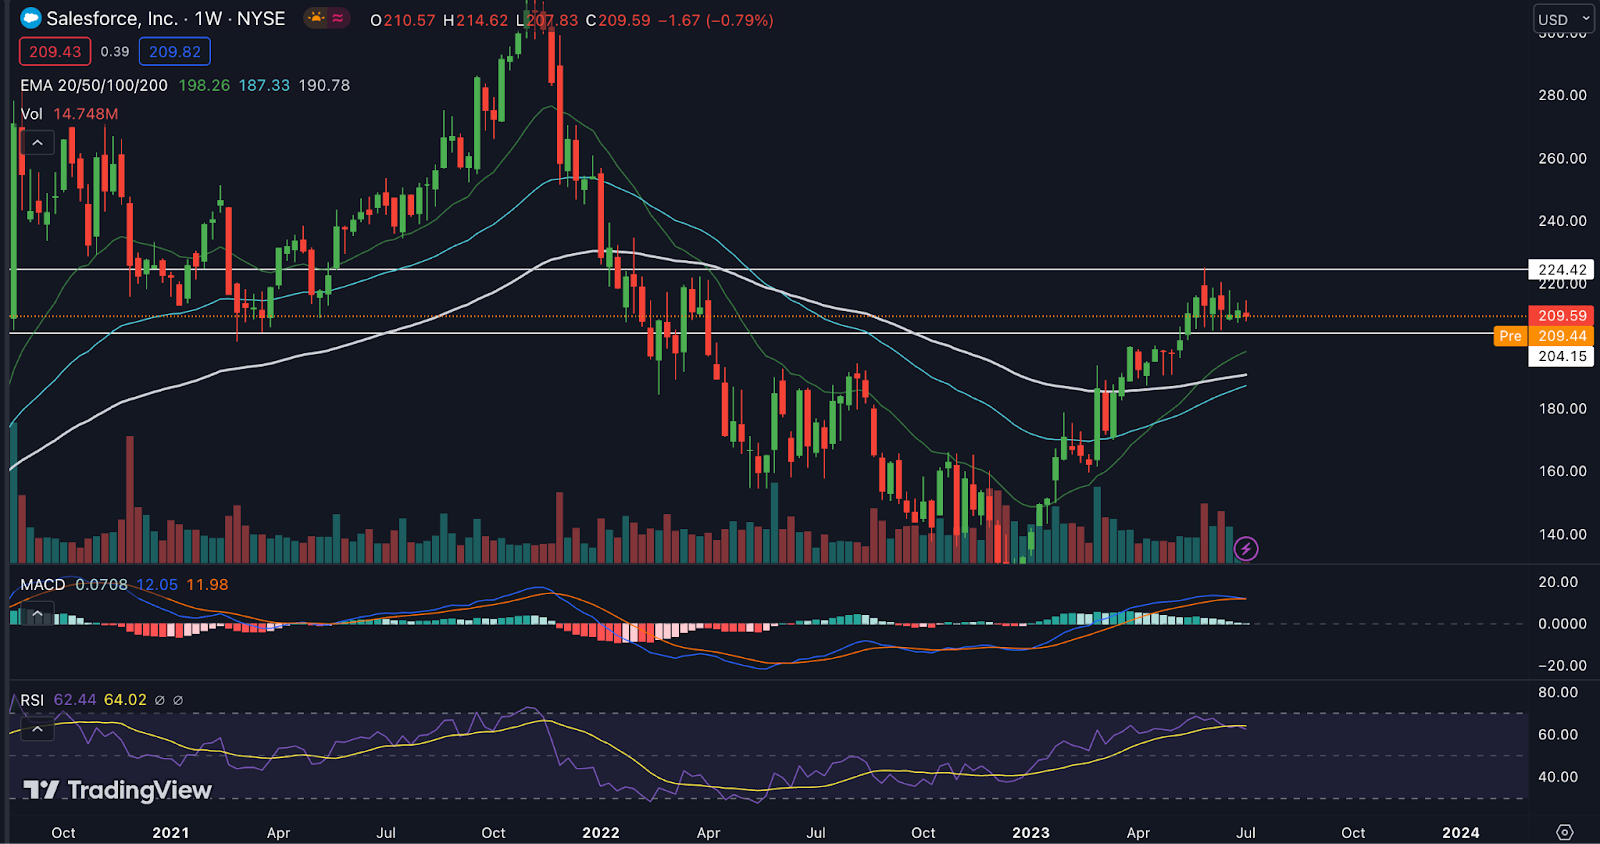
As per the chart in the weekly timeframe, the stock price of Salesforce Inc (NYSE: CRM) is currently in the uptrend direction.
The stock previously came into a downtrend direction after its high of $311 in November 2021 and after that price fell by around 60% in one year. The stock price of Salesforce Inc. took support at the $126 level and then the downtrend reversed.
Currently, the stock price of stock is trading at $209.59 and it is near the support level. The stock price is facing resistance at the level of $224. The price is moving in this narrow range for the past seven weeks and trying to give a breakout of the range.
If the price sustains above this resistance level we can expect a possible up move in the future. However, it is not advisable to take either side’s entry without any confirmation.
By looking at the fundamental factor of Salesforce Inc. (CRM) the forecasted growth for the CRM is 37.% which is higher than the growth of the US Market. Also, the one-year growth of the CRM is 20.2%. This signifies the company is performing well.
Salesforce Inc. (CRM) Stock Price Analysis
EMA
The average closing price of CRM crosses the 20-day exponential moving average (EMA) on a daily basis. This is a bullish sign. The average closing price for CRM is above the EMAs of 20, 50, and 200. The share price of CRM is on the rise, and buying-side investor confidence is expected to improve in the near term.
MACD
The MACD line of Salesforce Inc. is above the signal line on a weekly basis, indicating bullish momentum. The red histogram indicates bearish momentum. Salesforce Inc.’s price is expected to increase further in the near future.
Volume Analysis
According to the charts, the volume of the stock is progressively increasing, which is a favorable and encouraging sign for the upward trend in the stock price. This rising volume suggests greater market activity and perhaps greater investor interest in the shares of CRM.
Conclusion
According to the report, Salesforce Inc. has a strong market structure and a growing momentum. This upward movement is supported by indicators like MACD, RSI, and EMA, which suggest that the price of Salesforce Inc. may increase in the future.
Technical Levels:
- Support – is $204.
- Resistance – is $224.
Disclaimer
The views and opinions of the author, or anyone named in this article, are for informational purposes only. They do not offer financial, investment, or other advice. Investing or trading crypto assets involves the risk of financial loss.




