
 Boomer
 Covenant x402
 Claudia
 Pearl
Pearl Quantus
 Bitcoin
 NEAR Protocol
- NEXT stock price is currently trading at $5.31.
- The current trend in NEXT stock price indicates a bearish sentiment.
NextDecade Corp was founded in 2010 by Kathleen Eishbrener. NextDecade Corp(NEXT) is a development company that mainly focuses on liquefied natural gas (LNG) export projects and associated pipelines. NEXT is actively engaged in the management and development of both land-based and floating liquefied natural gas (LNG) projects situated on the Gulf Coast, particularly focused on the Rio Grande LNG project.
Downtrend to Continue in NEXT Chart?
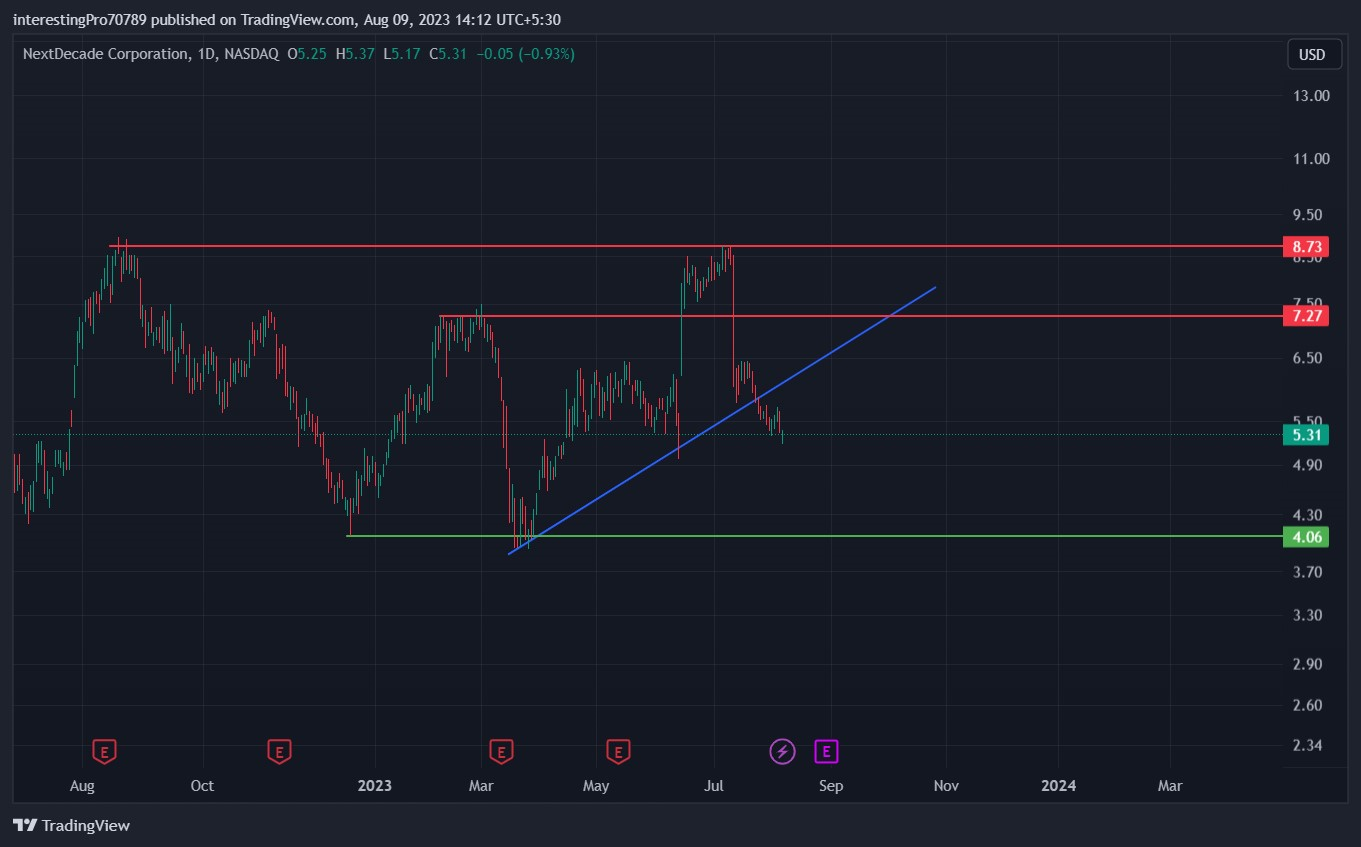
The recent price action of NEXT stock reflects a series of bullish rallies and subsequent rejections at key levels. In December 2022, the stock formed a strong support at $4.06, which was follow by a bullish surge to $7.27. However, the price faced resistance at this level and retraced back to the support. Another bullish move was observed, indicating buyer interest and reinforcing the $4.06 support.
During its uptrend, the price found support from an ascending trendline. While managing to break above the $7.27 resistance, the price’s ascent was halt at $8.73, resulting in a reversal due to institutional selling. This caused a notable red candle on the chart, signaling a fakeout and suggesting bearish pressure.
More recently, the price broke below the previously supportive trendline, leading to a downward movement. This breakdown could potentially drive the price towards retesting the $4.06 support level.
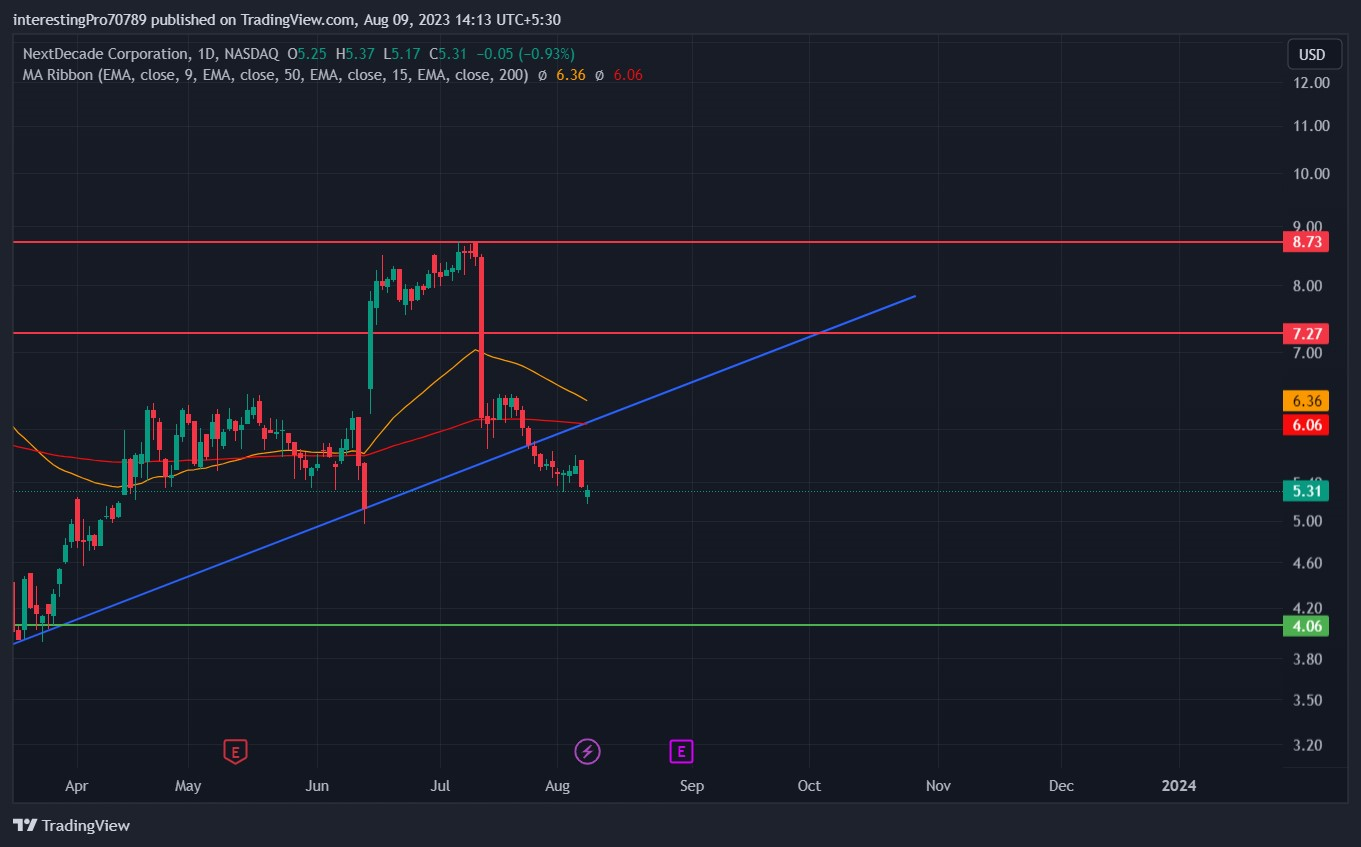
The 50 EMA (yellow line) is at $6.36 and the 200 EMA (red line) is at $6.06. Both EMA lines are trending in a downward direction and the price is trading below them, which indicates that a bearish sentiment is still prevalent.
Technical Indicators prediction about the current trend
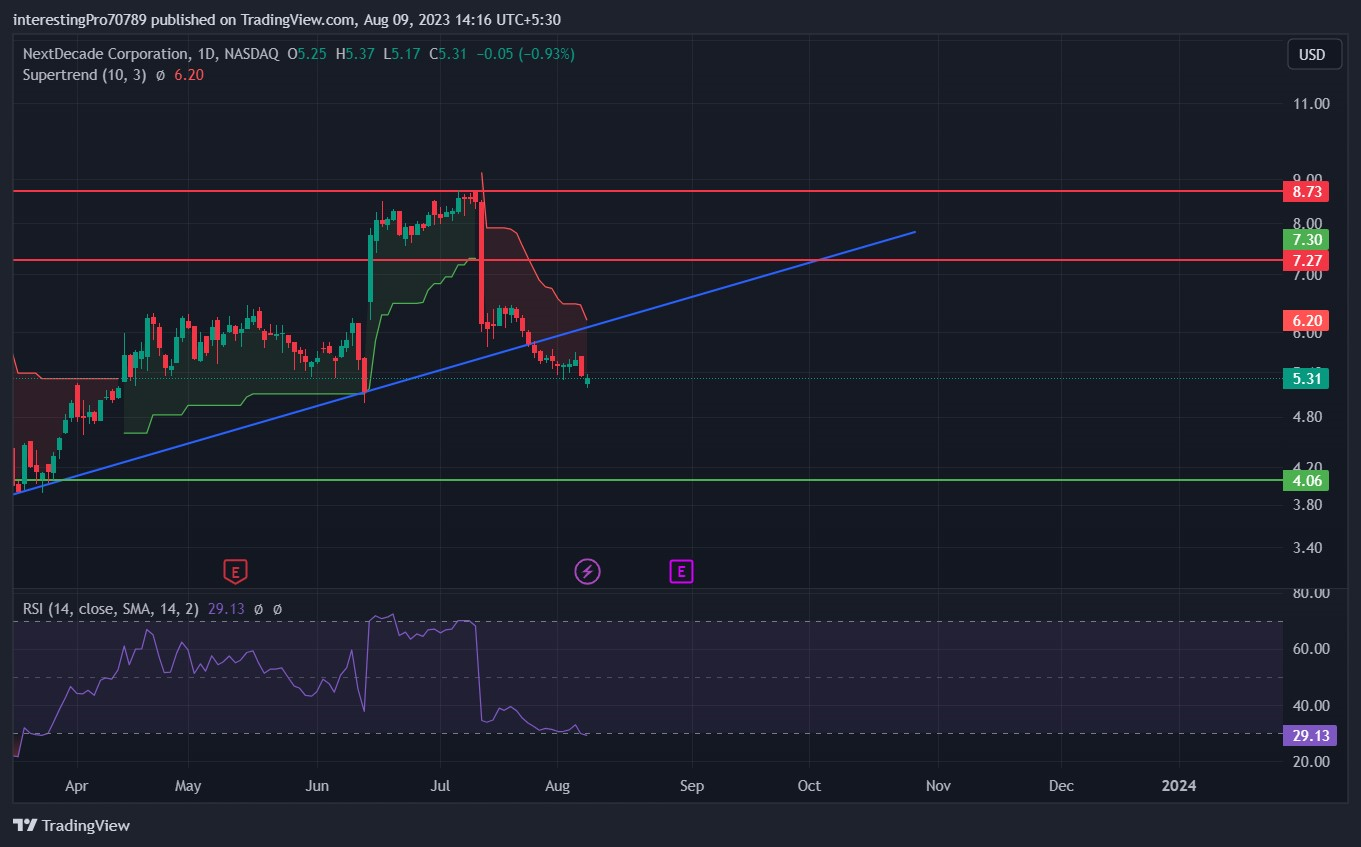
The relative Strength Index RSI is at 29.13, which shows that the price is in bearish territory for now, taking pressure from the seller side. RSI is moving into the oversold territory due to which a pullback can be seen in the NEXT price.
The SuperTrend indicator suggest a prevailing bearish sentiment for the NEXT stock, as the current price is situate below the red line. A potential shift towards bullish momentum might occur if the price manages to close above the red line.
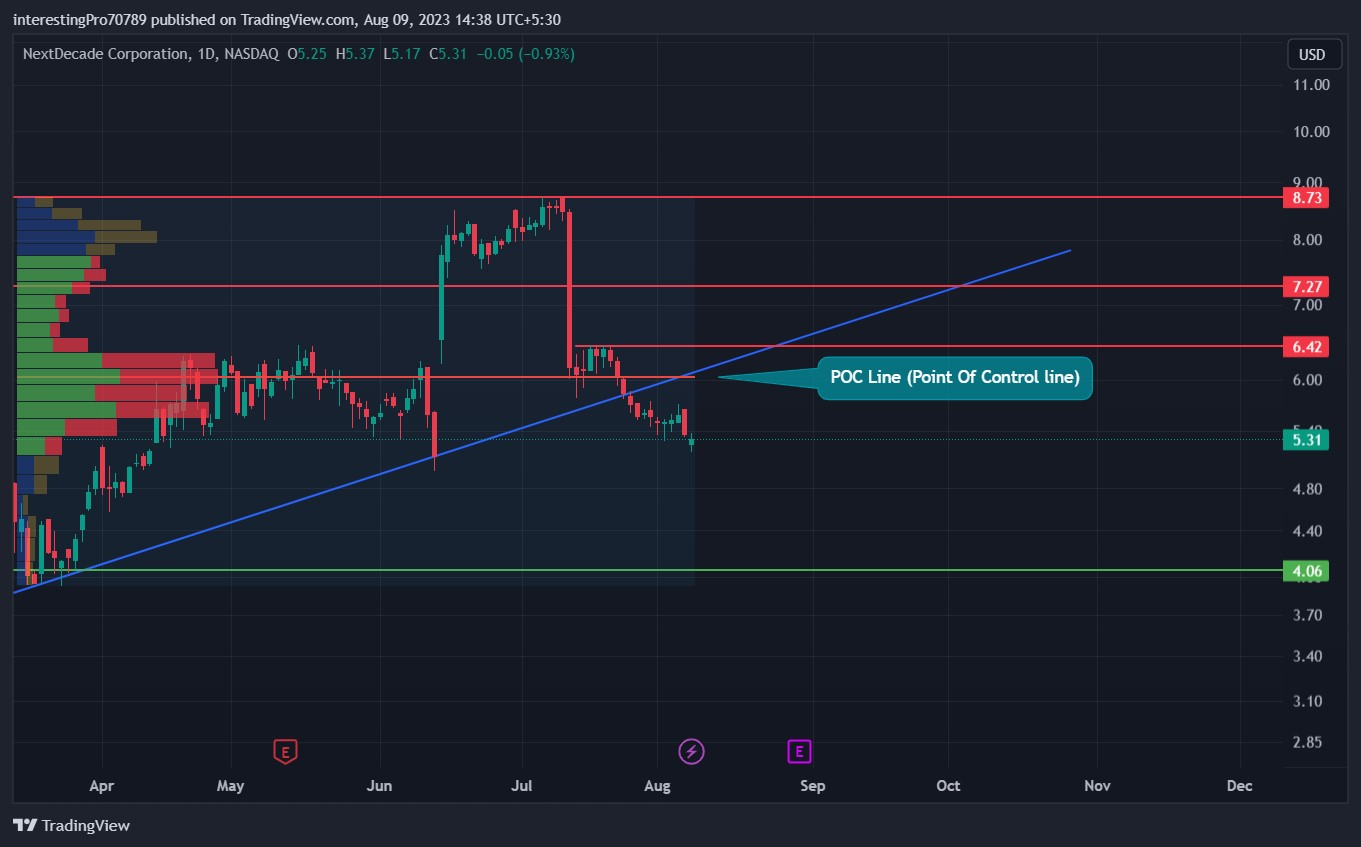
The Fixed Range Volume Profile highlights a significant observation: the price is currently trading below the Point of Control (POC) line. This indicates that a substantial number of sell orders have been place in this region. Considering this pattern, there’s a possibility that the price could experience a decline towards the $4.06 support level.
Conclusion
The overall outlook for NextDecade appears to be bearish, with indicators suggesting a potential retracement in the short term. Notably, the RSI is approaching oversold territory, which could imply a temporary pullback or reversal. In conjunction with other bearish indicators, such as the Fixed Range Volume Profile and SuperTrend, the price may indeed be susceptible to a decline towards the $4.06 support level. These indicators collectively reinforce the bearish sentiment in the chart and provide insight into the potential price movement.
Technical levels
Resistance levels: $6.42
Support levels: $4.06
Disclaimer
The views and opinions stated by the author, or any people named in this article, are for informational purposes only. They do not establish financial, investment, or other advice. Investing in or trading crypto assets comes with a risk of financial loss.




