
 Quack AI
 NEAR Protocol
 Monero
 Lighter
 Ethena
 Pons
Pons Sui
Sui
- PFC stock price is currently at $21.41
- The company stock chart is currently showing bullish sentiment.
Premier Financial Corp. is a holding company founded in June 1995. The company deals with the provision of banking business. The company mainly focuses on traditional baking and property and casualty, life and group health insurance. It provides family real estate, consumer, home equity and different kinds of loans.
Premier Financial Corp (PFC): Financial Analysis
Premier Financial report has shown stable growth within the last year with some up and downs in the revenue report from Q2 2022 to Q2 2023 with an overall growth of 0.46%. The Q1 2023 revenue report was down by -0.10% from the previous Q4 2022 revenue report but the company manages to recover the previous year’s decline with 0.56% growth in Q2 2023 revenue report.
The PFC Q3 2023 report estimated growth in revenue is expected to be 64.77M from the previous Q2 2023 report. The PFC revenue growth has shown a decent growth in revenue within the last year which shows the company can meet the estimated revenue in the Q3 2023 report.
The Premier Company had consistently paid an average of 35 plus payout ratio dividends over the last three years.
Premier Financial Corp (PFC): Technical Analysis
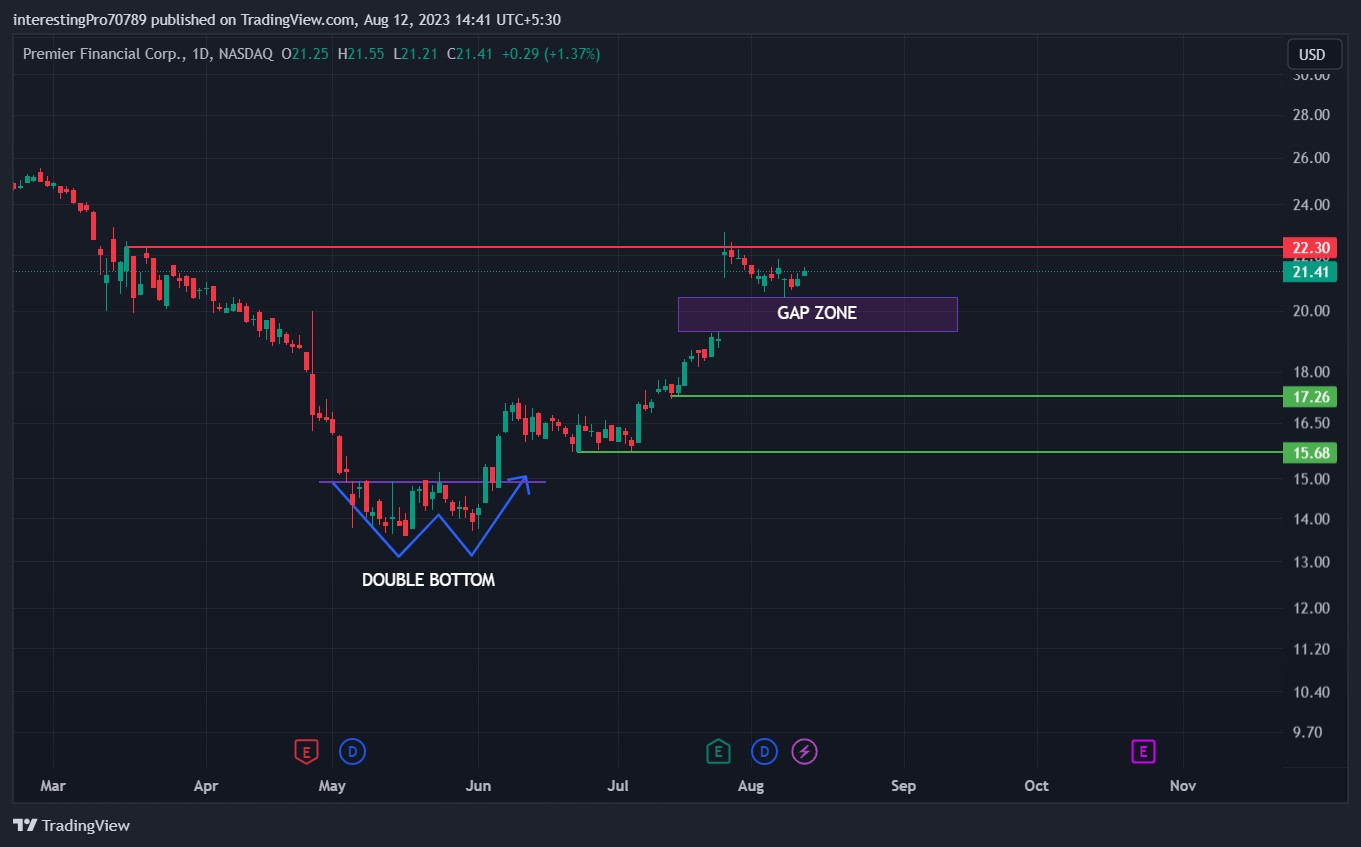
Currently, the PFC stock price is trading at $21.41 with an average volume of 128.561K and with a market capitalization of 746.983M.
In March 2023, the PFC stock almost fell more than 35% in three months. And in May the price formed a support of $13.55 and. The price consolidated at that level for one month made a double bottom pattern at that support level.
In June, the price gave a huge green candle breakout and commenced a bullish rally. The price went up making a higher high structure and almost formed a V shape recovery in the market. Recently the price showed a gap-up scenario and according to the price action, the price always fills the gap.
So if the price closes above the $22.30 resistance level then an upside move can be seen and the second possibility is that where the price failed to close above the $22.30 and faces rejection from there then the price will be the gap left in the market and can go for a pullback in short term till $17.26 support.
Technical Indicators Prediction about the current trend.
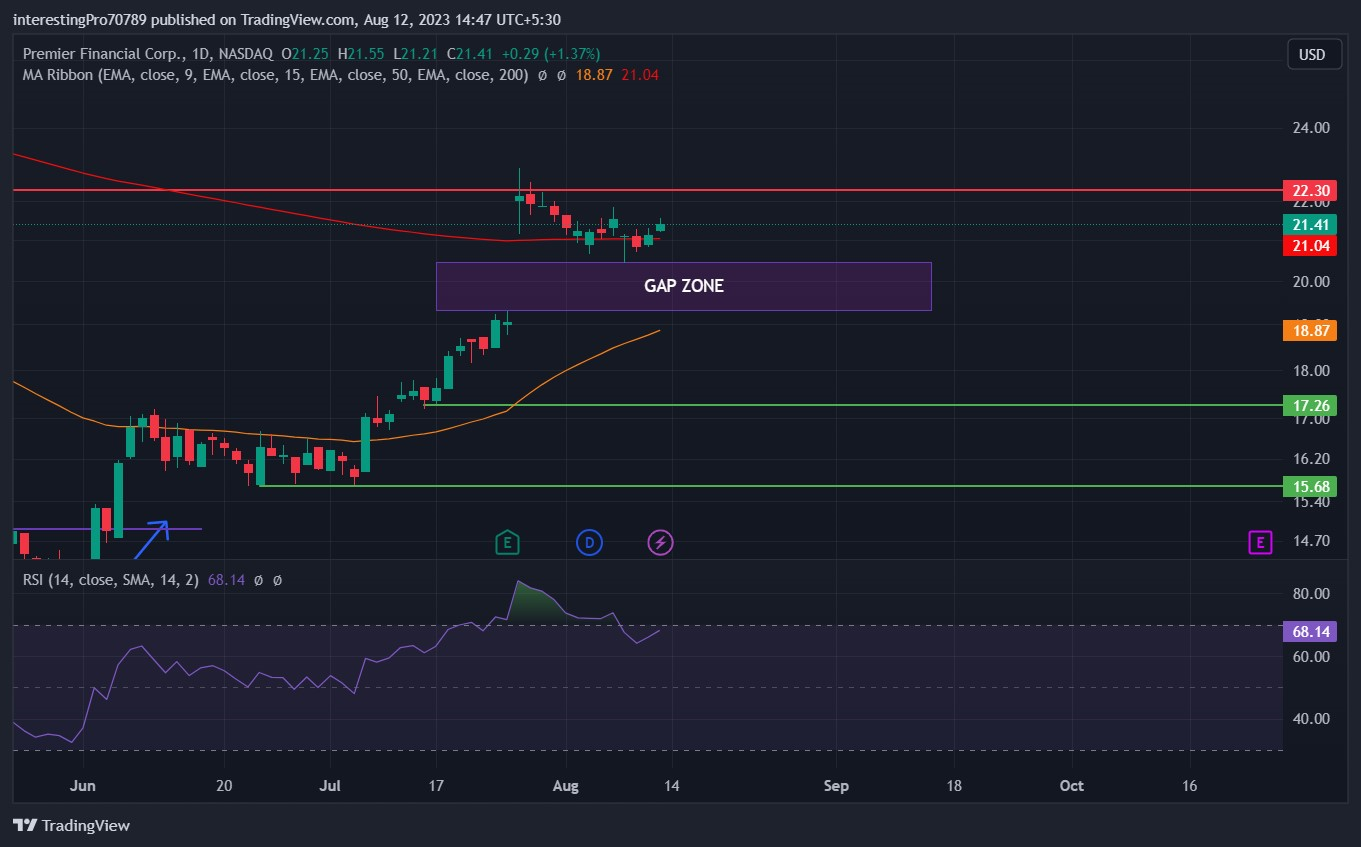
The 50 EMA (yellow line) is at $18.87 and the 200 EMA (red line) is at $21.04. Both EMA lines are trending in the upward direction and the price is also trading above the 50 and 200 EMA’s which indicates that the price is in bullish sentiment and the buyers are in control of the market.
The relative strength index RSI is at 68.14 which indicates that the price is bullish territory under the control of buyers. But the RSI is heading toward the overbought territory from where the chances of the pullback will increase in the short term.
Conclusion
The overall chart of PFC is in bullish sentiment as the price has gone up making a higher high structure in the market and now it is trading below the $22.30 resistance level and there is also a gap left in the market. So two possibilities can be seen first where the market continues to go up if the price closes above the $2.30 resistance and second scenario where the price failed to close above the $22.30 and faces rejection from that level and can come down to fill the gap left in the market.
Technical levels
Resistance levels: $22.30.
Support levels: $17.26.
Disclaimer
The views and opinions stated by the author, or any people named in this article, are for informational purposes only. They do not establish financial, investment, or other advice. Investing in or trading crypto assets comes with a risk of financial loss.




