
 Quack AI
 Pudgy Penguins
 Injective
 Solana
 NEAR Protocol
 Canton
 Zcash
Zcash
- Stellar price (XLM) slid 1.91% in the last 24 hours and is currently trading at $0.1263.
- Stellar Price (XLM) seems to have undergone a correction phase suffering multiple rejections from upper trendline resistance.
The stellar token was in a downward trend for a year, facing repeated rejections from a falling trendline and forming a descending triangle pattern. Thereafter, the price broke the downtrend and surged 80%, but suffered rejection from the upper supply zone and fell 20% from the high.
Recently, the price tried to hold near the upper levels but seemed to be losing momentum and got detained. The price formed bearish price action and slid down to break below $0.144.
Stellar (XLM) is a platform that lets users trade and settle different assets in a decentralized way. It has an order book that records who owns what on the network. XLM is the native coin that lowers the cost of transactions.
Stellar Price Prediction Using Price Action Strategy
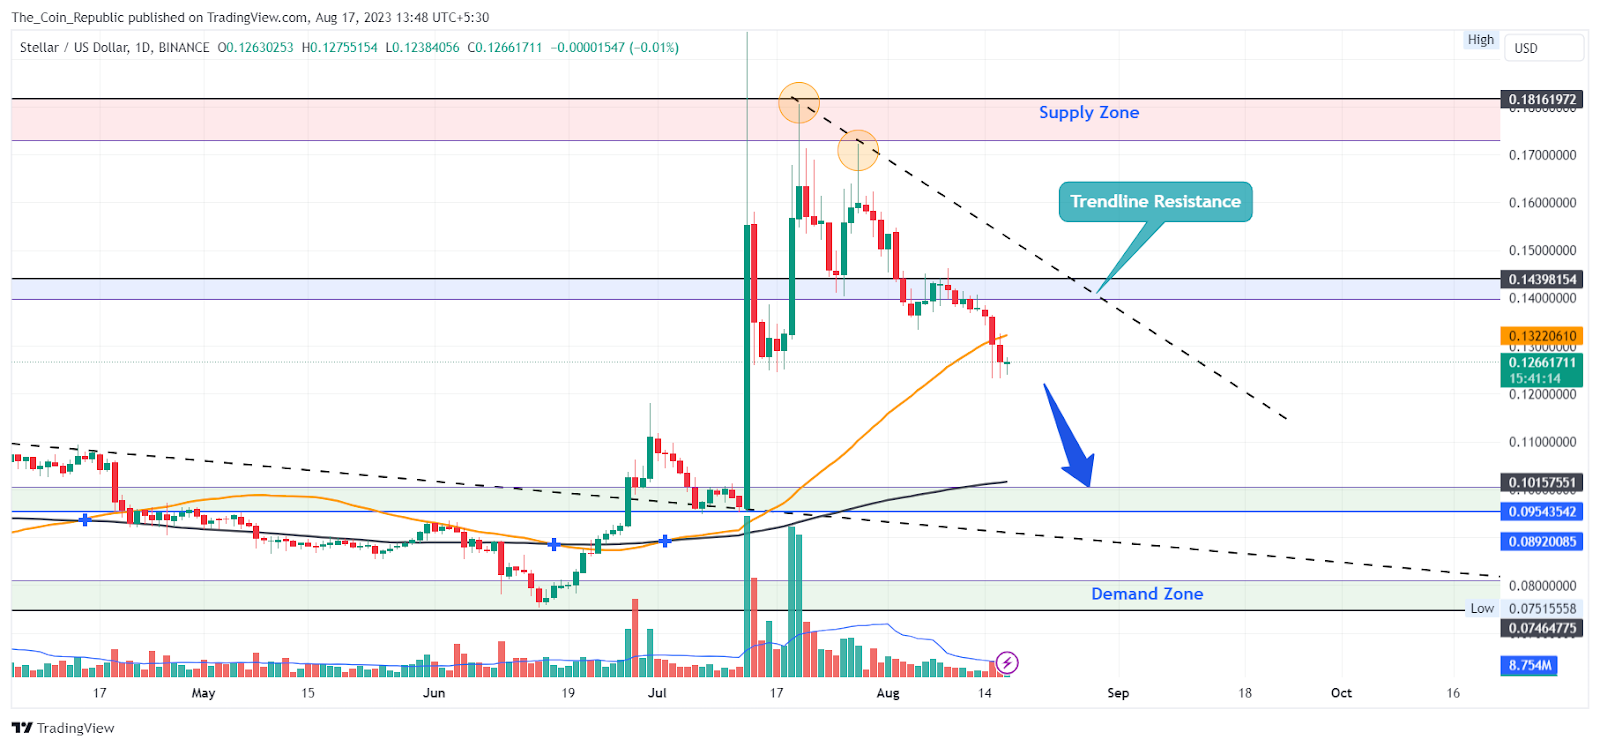
The analysts observe that Stellar Price may undergo a correction phase and decline to fill the imbalance created due to a sudden spike. The price is facing trouble staying high and may correct further.
Also, the volume analysis shows that the volume received is less than the average volume indicating the weakness in the market. The XML token has received a $90.5 Million volume in the past 24 hours which is nearly 23% less than the past day. The price may keep correcting until it gets enough buyers to surpass the upper supply zone.
XLM Price Forecast from Indicators’ point of view
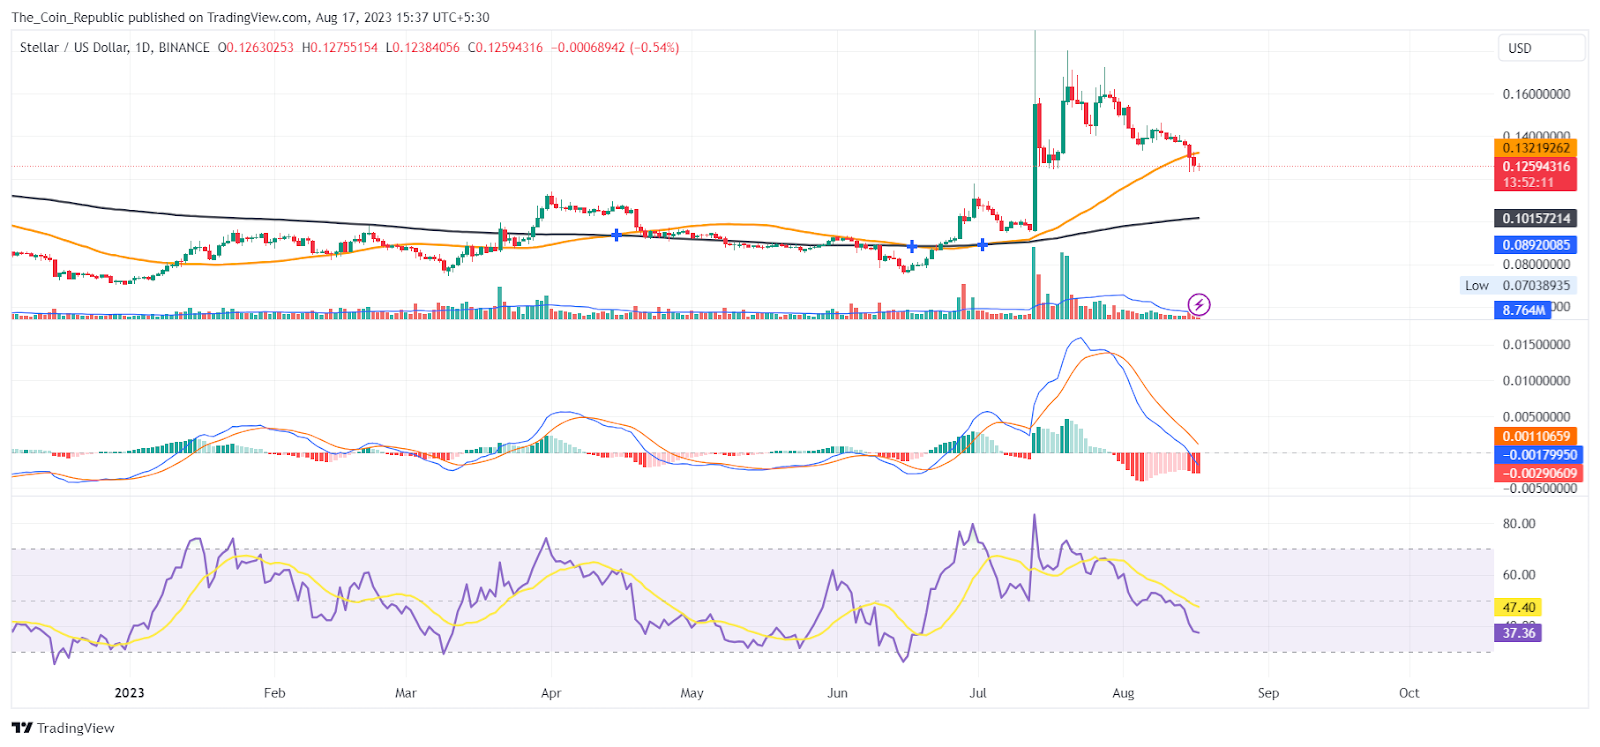
As per the EMA analysis, the XLM price could not sustain above the 50 EMA indicating the dominance of the selling pressure in the market. The price is trading above the 200 EMA which may act as a support to the declining price.
At the time of publishing, the RSI value of the XLM token is 37.42 and that of the SMA line is 47.40. RSI is declining suffering rejections from the SMA line indicating the price may continue to decline.
MACD lines have made a bearish crossover. Also, Histogram bars are being formed below the mean line with increasing height indicating a bearish sentiment in the market.
Conclusion
Stellar price prediction concludes that Stellar Price broke a year-long downtrend and rose 80%, but faced resistance and dropped 20%. The price is losing strength and may fall further to fill the gap created by the spike. The volume is low, showing weak market interest. The price needs more buyers to overcome the upper barrier. Also, the technical indicators signal the dominance of the sellers in the market and the price may resume its declination phase.
Technical Levels
- Support levels: $0.095 and $0.074.
- Resistance levels: $0.155 and $0.181.
Disclaimer
The views and opinions stated by the author, or any people named in this article, are for informational purposes only and do not establish financial, investment, or other advice. Investing in or trading crypto or stock comes with a risk of financial loss.




