
 Minter
 Sui
Sui Pons
Pons NEAR Protocol
 Starknet
 Quack AI
 Chainlink
- The WEIR stock price is trading at 1835.5 GBX.
- The company stock is forming an ascending triangle pattern inside a range of 1856.5 GBX to 1663 GBX.
The Weir Group (LSE: WEIR) provides the provision of engineering solutions which is operated through the following segment: Oil & Gas, Minerals, and ESCO. The company was founded in 1871 by George Weir and James Weir. The firm headquarters is situated in Glasgow, the United Kingdom.
Weir Plc Stock: Financial Analysis
From 2020 to 2022, the Weir Group revenue record has shown a respectable growth of 6.36 Billion GBP. In 2021 the company’s revenue was down by 0.01% compared to its previous. However, the company managed to show growth in its performance in 2022 by recovering the decline by 0.27%.
The company has a good dividend payout ratio. But in 2019 and 2020, the company didn’t pay any dividends to its shareholders.
Weir Plc Stock: Technical Analysis
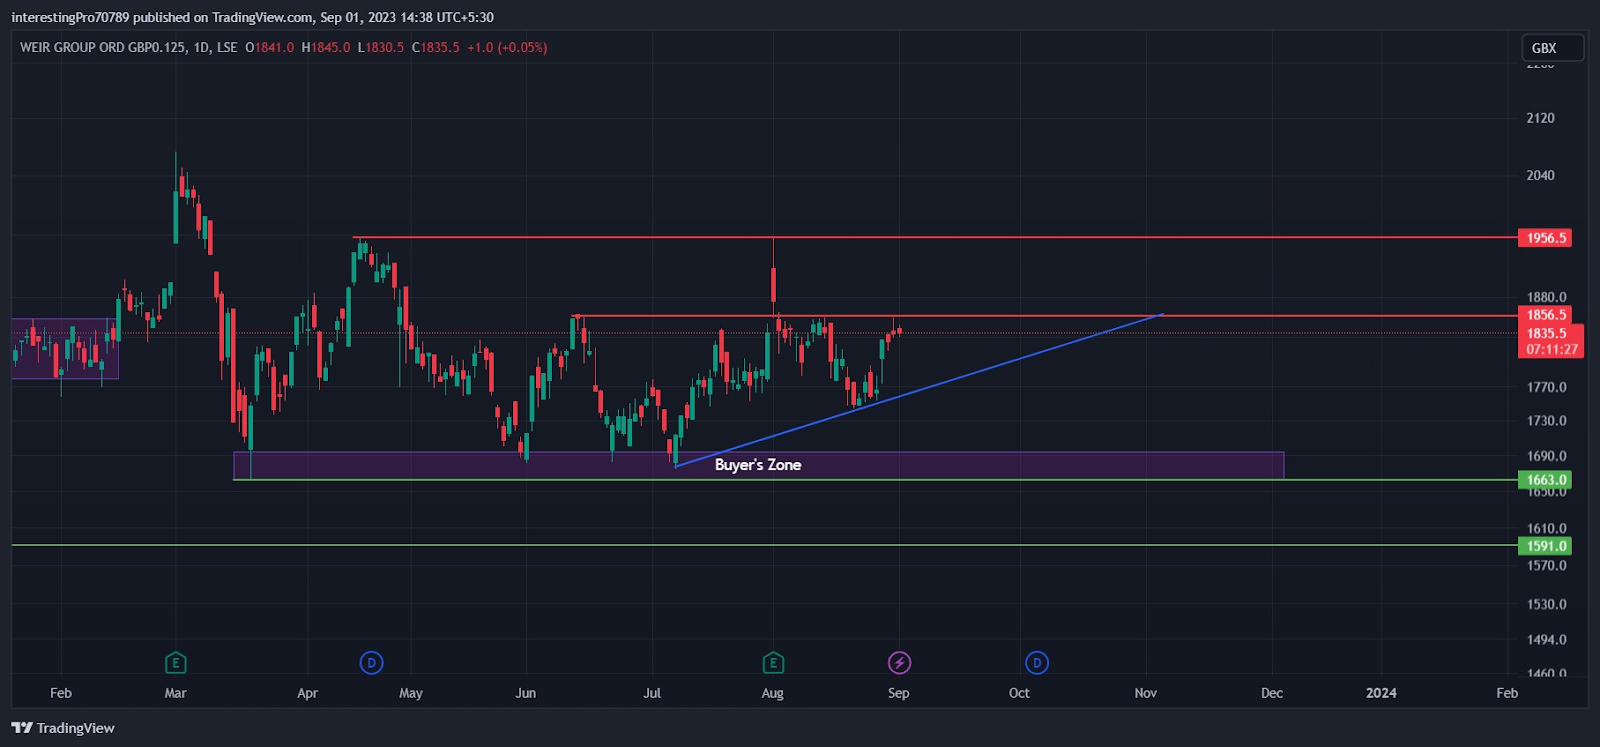
In March 2023, the company price formed support at 1663.0 GBX and commenced a bullish rally. The price was see rising to 1856.5 GBX. After reaching 1856.5 GBX the price was seen falling from there and went back to 1663 GBX support.
In June 2023, the price again commenced a bullish rally from the 1663 GBX support. This time the buyers were not able to push the price as much as they did previously. The price went to 1856.5 GBX and was see falling from there. The price again went back to its 1663 GBX support.
The buyers again commenced a bullish rally from there and tried to break above the 1856.5 GBX resistance. This time the buyers did close the price above the 1856.5 GBX resistance and pushed the price till 1956.5 GBX. After reaching 1956.5 GBX the price face an immediate rejection and was again see below the 1856.5 GBX resistance.
The price started to fall after the fakeout and took support from the trendline which was coming below. The price after taking support from the trendline is trading at 1838 GBX.
Currently, the price seems to be forming an ascending triangle pattern. the price is trading just below 1856.5 GBX resistance. If the price gives the breakout of the 1856.5 GBX resistance then the price could be seen commencing a bullish rally to 1956.5 GBX resistance.
However, if the price face rejection from the 1856.5 GBX resistance and breaks below the trendline the price could be see falling to its 1663 GBX support (buyer’s zone).
Technical Indicators’ Prediction About the Current Trend
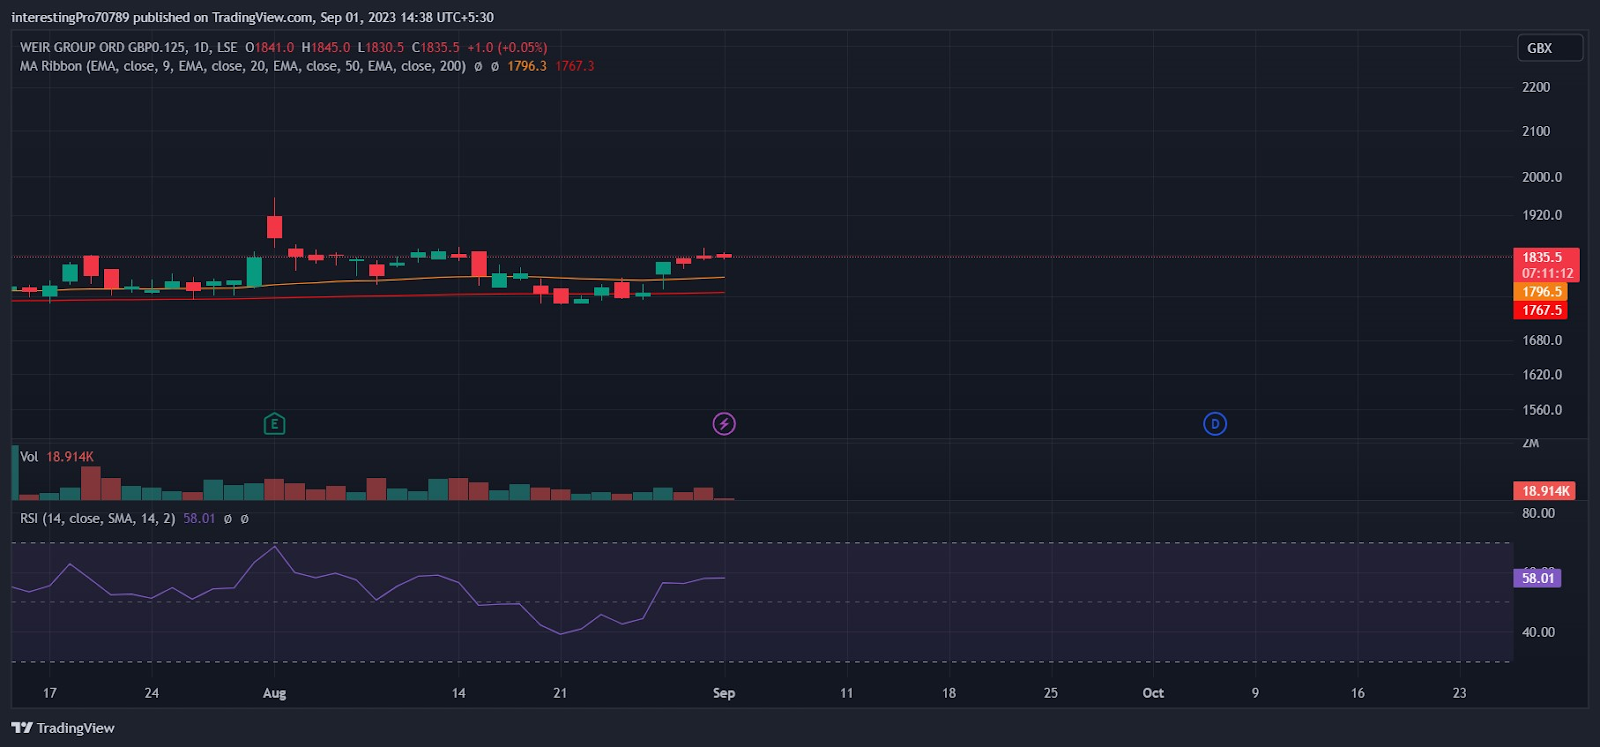
The 50-EMA line (yellow line) is at GBX and the 200-EMA line (red line) is at GBX. The price of WEIR stock is trading above the 50 and 200 EMA which indicates the bullish sentiment over the price.
The relative strength index is at 58.01. The RSI line is in neutral territory and is moving towards bullish territory. This indicates that the price is currently getting pressurized by buyers as well as sellers and soon the buyers can take full control of the price.
Conclusion
The overall chart of the Wier group is sideways as the price is trading in a range of 1856.5 GBX (resistance) to 1663 GBX (support). The price is also seems to be making an ascending triangle pattern which also a bullish pattern. The breakout of 1856.5 GBX resistance and the breakdown of 1663 GBX support will decide the future of the price.
Technical levels
Resistance levels: 1856.5 GBX and 1956.5 GBX.
Support levels: 1663 GBX.
Disclaimer
The views and opinions stated by the author, or any people named in this article, are for informational purposes only. They do not establish financial, investment, or other advice. Investing in or trading crypto assets comes with a risk of financial loss.




