
 Celestia
 Starknet
 Quantus
 NEAR Protocol
 Pump.fun
 Hyperliquid
 LayerZero
- RNWH stock financial statement analysis. Know how the company is performing beyond its share prices.
- The company is constantly cash flow positive and giving good dividends. Down below is the answer to whether the company is investable.
- The RNWH stock is rising from its support level. But the bears may be active nearby. Know the levels below.
RNWH Plc, Previously known as MONTPELLIER GROUP PLC is an engineering services provider company. It is involved in the business of Developing energy, environmental, and infrastructure markets. Being established in 1960, this firm has a team of 4-thousand-plus employees. Paul Scott is leading the company as a Chief Executive Officer (CEO) and Sean Wyndham-Quin is the Chief Financial Officer (CFO).
Financial Analysis of RNWH Stock
The annual financial reports of the company reveal the Income statement. It shows a constant growth of revenue for the last 4 years. The revenue from 2018 to 2022 grew with a Compound annual growth rate (CAGR) of 8.6%. The company made a revenue of £816M by the end of 2022.
Coming into the unit economic levels, after the COGS of £700M the company takes away a gross profit of £115M with a gross margin of 14%. The operating profit of the firm was £47M and the earnings before interest and taxes (EBIT) margin was 5.7%
The Engineering giant gets away with a net profit of £37 Million, which is 4.8% of the total revenue. It has enabled the company to maintain its dividend payout ratio of about 35%. The dividend yields have been between 1.8% to 3%.
Furthermore, the profitability ratios like the return on equity are 25% on average in the last few years.
Important to note that the company is generating over 27% returns over its invested capital (Total assets and its working capital). That is a good percentage better than the performance of competing firms.
The Balance Sheet and Cash Flow Statement
The balance sheet of the firm looks balanced on the asset side. Short-term assets like Cash and equivalents are seen increasing with some volatility. While long-term assets like long-term investments are growing along with the property plant and equipment. That indicates the company is constantly reinvesting via capital expenditures.
On the other hand, the current liabilities have been decreased with some increment in between. The company took some short-term loans of £20M and they were later reduced to just £5.8M.
The current RNHW Stock price ratio of the company is on the lower side of 0.83. It may cause some troubles in a liquidity crunch. On the other hand, Renew Holdings has worked on declining its long-term loans from £24M in 2018 to just £8.64 M as of this writing.
The cash flow statement of the company is green all over the place. Renew Holdings has been a cash flow positive for years. The firm is generating cash from its operations. The Earnings before interest, taxes, depreciation, and amortization (EBITDA) have been more than the changes in working capital (Current assets – Current Liabilities).
The RNHW company generated a CFO of £57 million last year. That makes up a CFO-to-sales ratio of about 6% and a CFO/EBIT ratio of 89%. It is a positive sign in the correlation between the profit and cash.
The company is making regular investments in the Cash from investing activities segment. The net cash flow of last year was £30 Million.
Technical Analysis of RNWHL Stock
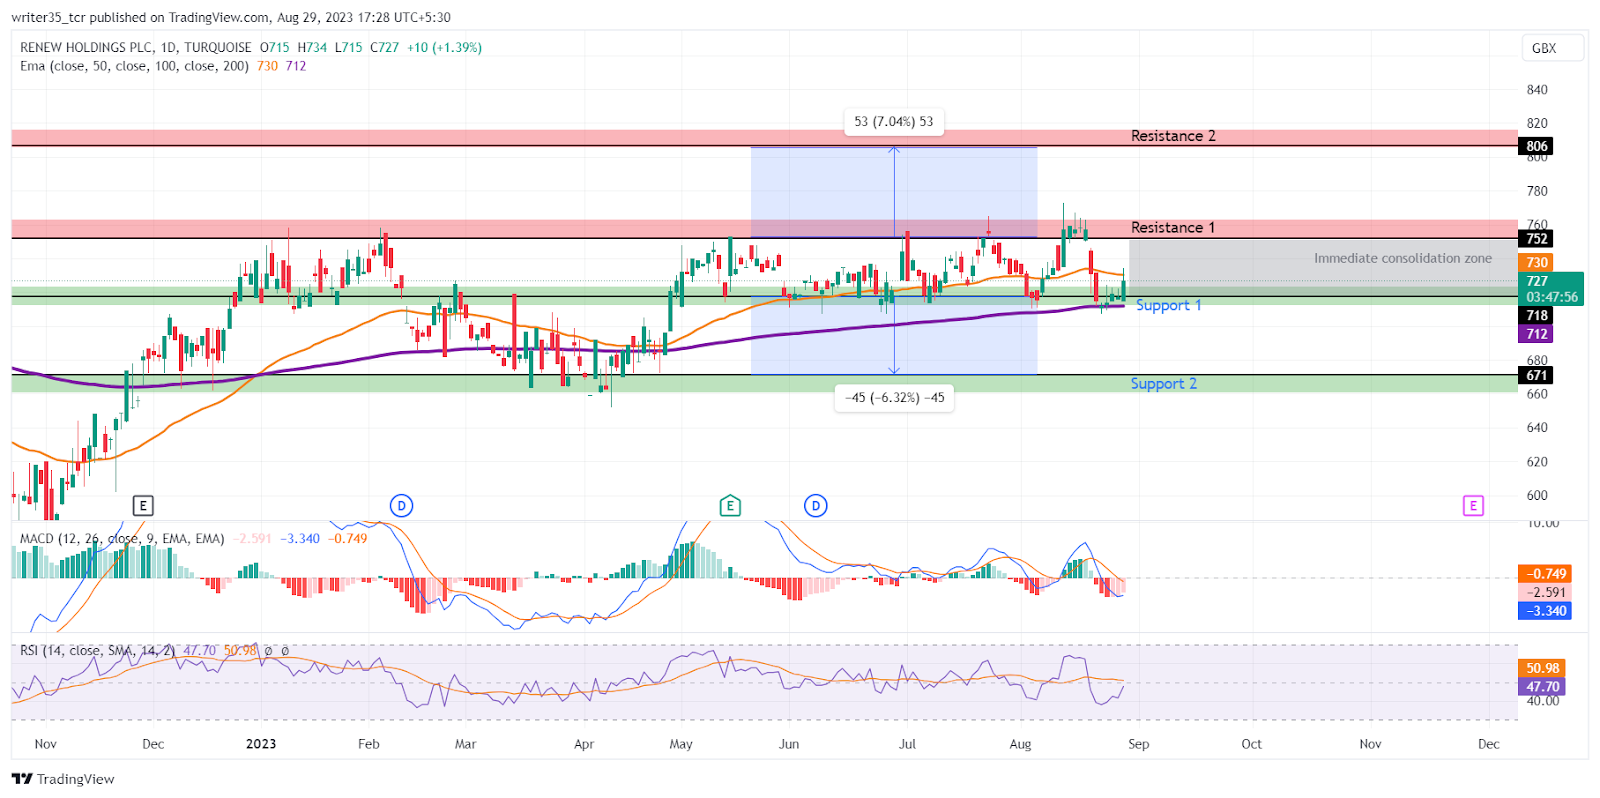
The RNWH stock came in a slightly bullish trend after breaking its immediate resistance level of £671 back in November of 2022. The stock has seen a consolidation since April 2023 with a floor of £722 and a cap of 752.
The stock is currently trading at the level of £727. It is seen increasing above its current support level of £718. The second support for the stock is seen below at the level of £671. It was the broken resistance back in November 2022.
On the other hand, the immediate resistance is at the level of £752. The second resistance is at the level of £806. That level occurred on the rejection levels that occurred during the end months of 2021.
What Do Indicators Signal?
Between these supports and the resistances, indicators like MACD are showing a possible downtrend. The MACD line made a bearish crossover with its EMA 9 days ago as of this writing. Currently, the MACD at -3.181 and its EMA at -0.717 are down below the neutral zone.
The RSI on the other hand is seen coming up to the level of 48 after spiking from its oversold levels of 38. As of this writing, it is looking to make a bullish crossover with its SMA at the level of 51.
The Exponential moving average of the RNWH stock price has interacted with the price action recently. The 200 EMA is seen in a bullish trend with a level of £712, below the support level. Similarly, the 50 EMA is seen above the price at £710.
Is it worth buying RNWH stock?
Looking from a long-term perspective, the stock seems stable and defensive. Investors can get along with RNWH in expectation of decent returns. As we saw in the financial analysis with recurring income in the form of dividends. The company is looking to focus on a stable growth rate with some reinvestments.
For trading the RNHW stock, you should assess the price action with its EMAs. If the price goes past its 50 EMA and sustains after taking its support, a bullish momentum may occur. If the bears get going, the RNHW stock may take a tour of its 2nd support level.
Technical levels
Support: £718, £671
Resistance: £752, £806
Disclaimer
The views and opinions stated by the author, or any people named in this article, are for informational purposes only. They do not establish financial, investment, or other advice. Investing in or trading crypto assets comes with a risk of financial loss.




