
 Minter
 Quack AI
 NEAR Protocol
 Pearl
Pearl Monero
 Pons
Pons Sui
Sui
- The stock has seen some recent downtrends but the bulls are not giving up
- The stock price is moving towards its first resistance but the bullish investors bowed down to the 50 EMA level.
- The MACD and RSI have given a slight bearish signal but this is likely to reverse.
The Kingfisher stock started falling after reaching its year-to-date high. During February, the KGF stock price was seen moving with bullish momentum as it broke its major resistance of £269. However, the bears took charge and the price levels couldn’t sustain past this resistance.
The KGF stock had been on a bullish trend for quite some time, with the short-term investors and traders alike enjoying the upward bullish rally. However, this trend soon came to an end as the stock broke its major support level of £250.
Technical Analysis and Price Prediction
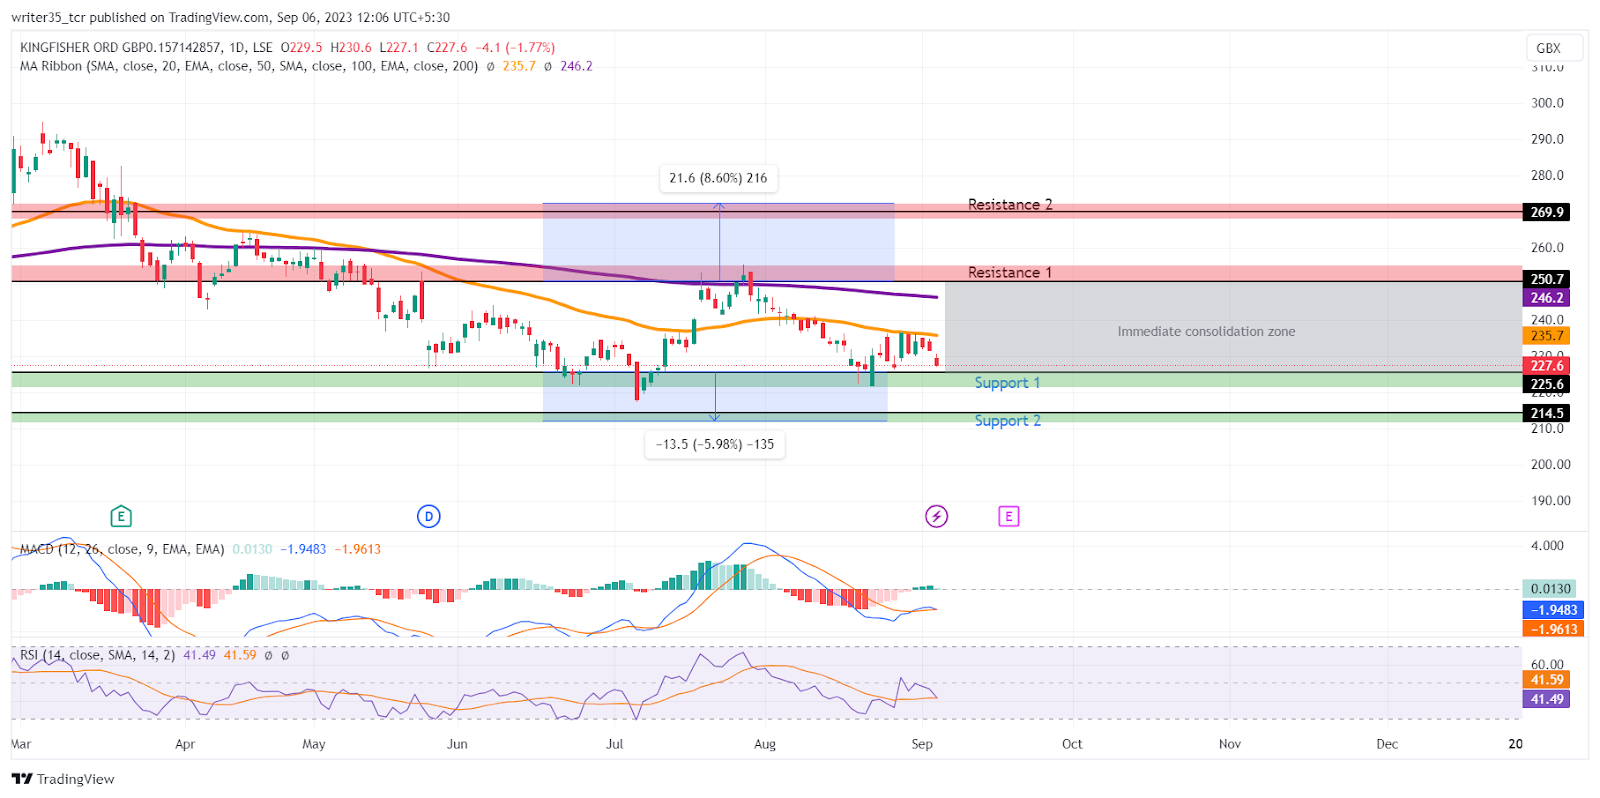
Following this development, the bulls and bears started a tussle. This led to a period of consolidation for KGF stock which lasted from the middle of May until now. At the time of writing, the stock is seen bouncing off after reclaiming the immediate support of £225, which has brought a glimmer of hope to investors.
The support level located in the demand zone is considered to be a strong point for the bulls. It is likely that the stock will move on the upper end to fill the gap that was created during July of this year. After the liquidity fill, the stock is expected to move towards its immediate resistance level of £250. If the bullish momentum is strong enough, the KGF stock price may break past this resistance and potentially reach its second resistance level of £269.
What the indicators are showing
Analyzing the support and resistance levels, along with taking indicators like MACD into consideration, it appears that there’s a mild bearish sentiment in the KGF stock. This sentiment might be influenced by recent occurrences of red candles in KGF’s price chart. However, it’s worth noting that the MACD line and its EMA are presently very close in value, at -1.94 and -1.96 respectively, which could potentially indicate an impending bullish crossover.
Moreover, Looking at the recent performance of the RSI line, we can see that it spiked off after touching its oversold levels of 33 back in August of this year. Since then, it has been on an upward trend and is currently hovering around the neutral level of 41. This indicates that the KGF stock price is currently not overbought or oversold.
The exponential moving averages (EMAs) are currently positioned above the price and may soon reject the bulls. Back in May 2023, the 50 EMA made a bearish crossover with the 200 EMA. At the time of writing, the 50 EMA is at the £235 level and has recently caused a short downtrend in the KGF stock price by rejecting the bulls. On the other hand, the 200 EMA is currently at the £246 level.
Conclusion
The price prediction for KGF stock will be bullish if the next bounce-off can break past the 50 EMA level. This trend is likely to happen as the current support level is strong enough to withstand the momentum of bears.
Technical Levels
Support:£225, £214
Resistance: £250, £269
Disclaimer
The views and opinions stated by the author, or any people named in this article, are for informational purposes only. They do not establish financial, investment, or other advice. Investing in or trading crypto assets comes with a risk of financial loss.




