
 Quack AI
 NEAR Protocol
 Quant
Quant Quantus
 Pearl
Pearl Ondo
Ondo Bitway
- The stock is seen reclaiming its support level, while the bears are trying hard to break it.
- The company is facing challenges as its revenue continues to decline while it grapples with a substantial debt load compared to its available reserves.
- The company is giving consistent dividends.
Bt Group PLC (LON: BT.A) is a UK-based company which is headquartered in London. It operates in different segments such as Enterprise Based, Global, and Openreach.
The Enterprise segment markets communications and IT services to businesses and public sector organizations, while the Global segment includes managed networks and IT infrastructure services. The Openreach segment builds and manages the fixed network that connects homes and businesses.
Financial Analysis of BT Group Plc
Our financial analysis will start with the income statement and then it will proceed to the Balance sheet and the cash-flow statement of the company. In between we will also examine some important metrics and ratios that will help us understand the financial health of the BT group.
First, looking at the present and historical income statement of the firm, the eye-catcher is the revenue growth. The company made a revenue of £24 Billion in 2016 and since then, it has not been able to get past this level. The revenue numbers have been declining with an average year-on-year growth of 3% and the annual revenue reported in 2022 was £20 Billion.
The firm takes away a gross profit of £3.4 Billion with a gross margin of 16.6%. The company has burned the majority of gross income on research and development which is followed by indirect general costs. This leaves the Earnings before interest and taxes (EBIT) as £2.81 Billion.
Furthermore, after paying corporate taxes, the firm makes a net income of £1.91 Billion which is 9.2% of the total revenue incurred. With a positive net income comes profitability ratios and dividends.
BT Group is known for giving regular dividends to its shareholders. With a dividend yield of 4.23%, the company is maintaining a dividend payout ratio of an average 58% over the past 7 years. Coming down to some profitability ratios, the Return on equity is 12.8%, its price-to-earnings ratio is 7.7 and its return on assets is 3.72%
Balance Sheet and Cash Flow Statement
Moving towards the balance sheet statement, the assets side appears to be unstable. The short-term cash and investments side has seen a decrease since 2019. Long-term assets, particularly net property, plant, and equipment, have shown a declining trend since 2019. However, when looking at the trailing twelve-month values, these assets appear to be experiencing some growth.
On the liabilities side, the company has a current liability of £9.8 Billion which makes up a current ratio of 0.87 and indicates a lack of working capital in the firm. The ideal current ratio should be somewhere near 2.0.
Moreover, the long-term debt has increased. However, looking at the slightly declined reserves in the equity section, this debt looks out of control. The debt-to-equity ratio also confirms it with a high value of 1.65.
We will now look at the cash flow sheet. One of the most vital sections of this statement is the cash flow from operating activities.
On the books of BT Group, the cash from operating activities is positive because of the control over creditors of the company. Another important ratio, CFO to EBIT for the firm is 80% which indicates that a good amount of the EBIT is getting converted into actual cash.
When considering the cash from investing activities, we see that BT Group is investing heavily in Assets. However, due to a large depreciation amount, the net Assets are not increasing by a significant margin on the balance sheet. At the end of the cash flow statement, the net cash flow for 2022 is £35 Million.
Technical analysis and price prediction of BT.A stock
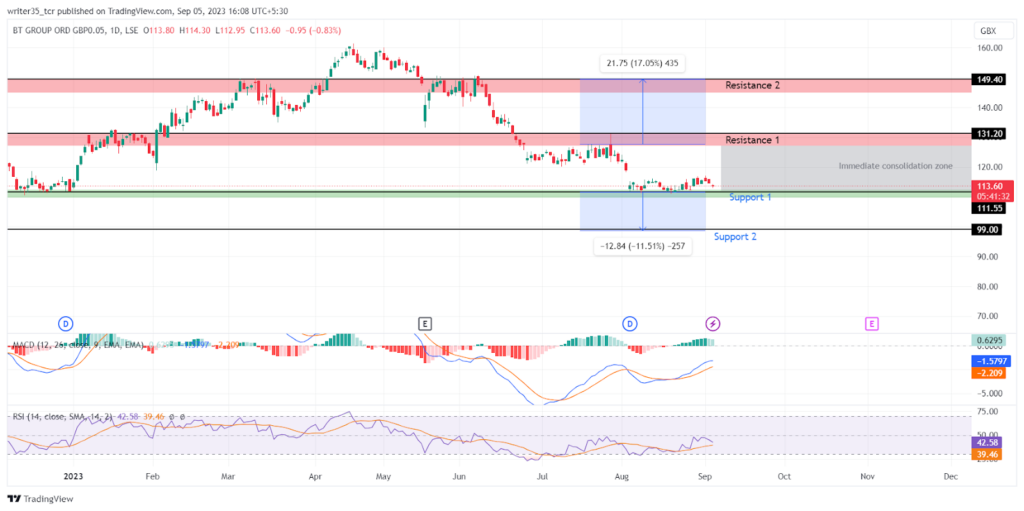
The BT.A stock price has been on a downtrend since June this year, declining after deviating from its resistance level of £149. Currently, the stock is trading at £113, with bulls working to prevent it from falling below the immediate support at £111. It appears that the bears may be in the supply zone around £131, which serves as the immediate resistance, with the second resistance level at £149. Conversely, there is a significant support level at £99, which may come into play if the bears gain more control.
Between the supports and resistances, indicators like MACD and RSI are both showing a slight uptrend. The RSI line spiked up after touching its oversold level of 30 back in August while its SMA made a bullish crossover. Similarly, the MACD and its EMA made a bullish crossover back in August on nearly the same day as the RSI. At present, the RSI is near the neutral territory of 42, while the MACD is at -1.59 near its neutral zone of zero
Is it worth buying BT.A stock?
Following the technical analysis, it appears that the current support level. Which the stock is currently reclaiming, could prove to be robust for the bulls. Additionally, the bulls are likely to first attempt to fill the gap created by the downward opening. That occurred at the beginning of August. Subsequently, the BT.A stock price may target its immediate resistance level. However, while it’s improbable, if a strong bearish trend emerges, the stock could breach its immediate support level.
From an investor’s perspective, BT Group appears to be facing significant instability as a company, compounded by negative revenue growth. And a high debt burden. However, considering the trailing twelve-month figures, the company seems to be showing signs of a potential rebound. Therefore, a prudent decision might be to wait for a comprehensive. And conclusive report on its 2023 performance before making any investment choices.
Technical levels
Support: £111, £99.0
Resistance: £131, £149
Disclaimer
The views and opinions stated by the author, or any people named in this article, are for informational purposes only. They do not establish financial, investment, or other advice. Investing in or trading crypto assets comes with a risk of financial loss.




