
 Quack AI
 NEAR Protocol
 Zcash
Zcash Celestia
 Pons
Pons Pudgy Penguins
 Bitcoin
- The RMV stock is trading inside a Symmetrical Triangle Pattern.
- It has been trading in a flat range since the beginning of this year.
- The company is holding more cash than its net debt.
Market capital of the Rightmove stock – 4.476 GBP
The current market price of the Rightmove stock – 567.6 GBX
Rightmove (RMV) Stock Overview
The stock in its previous trading session of 22 September jumped by 13.2 GBX with a rise of 2.38%. Its price has surged by over 0.78% in a week and 5.19% in a month, which signifies that the price is in bullish momentum on a shorter horizon. The price has declined by 4.19% in a year. It shows that in the longer time frame, the price has been controlled by the bears.
The revenue of the stock has escalated from 219.99 Million GBP in 2016 to 332.62 Million GBP in 2022. It experienced a rise of over 51% in 6 years, which is considered as a good growth in terms of revenue. The net profit of the company has also boosted at a same pace of 51% from 129.54 Million GBP to 195.68 Million GBP in 6 years.
The total debt of the company is 9.57 Million GBP. Yet, it is not a matter of concern for the company as the net debt is in a negative figure. That indicates the company is holding more cash than financial obligation. The company has paid a dividend yield of 1.66% in a year. It states that the company is not a good option for dividend-seeking investors.
Technical Analysis of Rightmove (RMV) Stock
The stock has formed a symmetrical triangle pattern on a daily chart. If we observe deeply, the price of the stock has traded in a flat range since the beginning of the year. If the price breaks the level on either side, we can expect that the price can get some necessary boost to escape from this range.
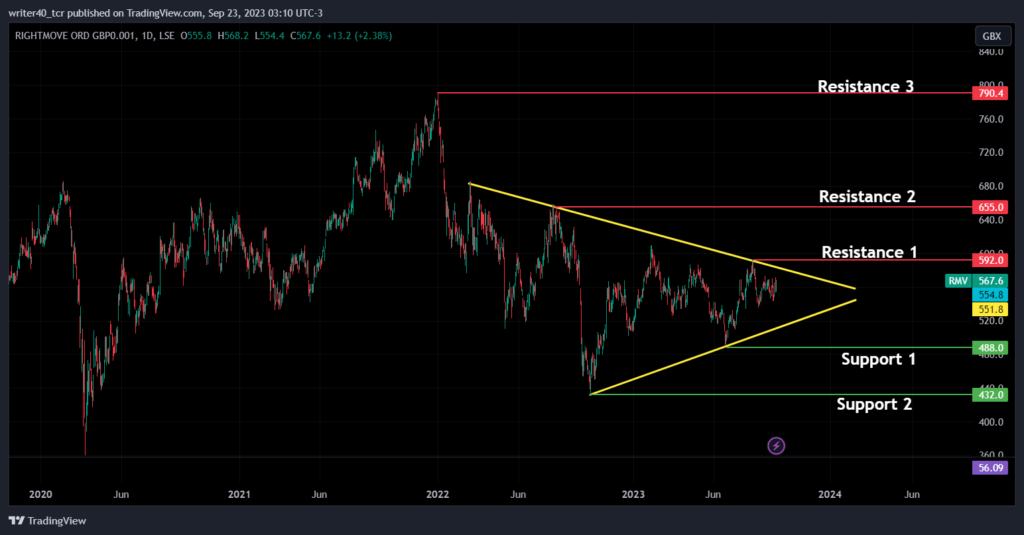
If the stock price breaks the range on the upside, it can face some rejection near the level of 592 GBX. That is drawn as Resistance 1 on the chart. Then the other 2 resistance i.e. resistance 2 and resistance 3 are present near 655 GBX and 790.4 resistance levels GBX respectively. The support for the price is present near the level of 488 GBX and 432 GBX.
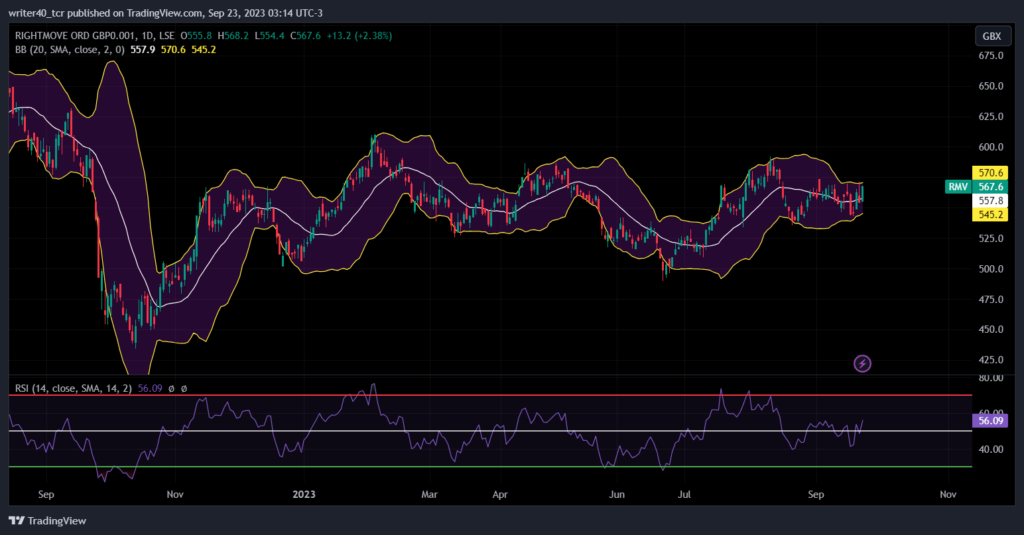
If we observe the Bollinger bands indicator, it has now squeezed in a short range. The upper limit is present near 570.6 GBX and the lower limit is present near 545.2 GBX in that range. The median line of the Bollinger band is present at 557.8 GBX. The Relative Strength Index is currently above the 50 level and slowly rising. It states that the bullish momentum is getting stronger.
Conclusion
The finances of the company are performing well but the price has been trading flat for so long. The price has formed a symmetrical triangle pattern, the RSI is getting momentum, and the Bollinger band has now squeezed. That indicates the price can soon move strongly on either side.
Technical Level
Resistance – 592 GBX and 655 GBX
Support – 488 GBX and 432 GBX.
Disclaimer
The views and opinions stated by the author, or any people named in this article, are for informational purposes only. They do not establish financial, investment, or other advice. Investing in or trading crypto assets comes with a risk of financial loss.




