
 Dacity Coin
 Zcash
Zcash Sui
Sui Injective
 Quantus
 Pearl
Pearl NEAR Protocol
- QTUM price has experienced a decline of 0.6% in the last 24 hours.
- The coin chart reflects the sellers’ presence and control over the price.
Qtum is an open-source blockchain technology that brings together the strengths of Bitcoin and Ethereum in one chain. Its coin was introduced on March 1st, 2016, and on October 31, 2016, its prototype was made available.
Qtum Coin Technical Analysis
In the last 24 hours, the QTUM coin’s price faced declined by 0.6%. The Current trading value of the coin is $ 2.156, with a 24-hour trading volume of $23,180,889. The current market capitalization of the coin stands at approximately $226,830,112. Additionally, the coin has a circulating supply of 104,755,842 QTUM coins.
Technical Analysis QTUM 1-Day Timeframe
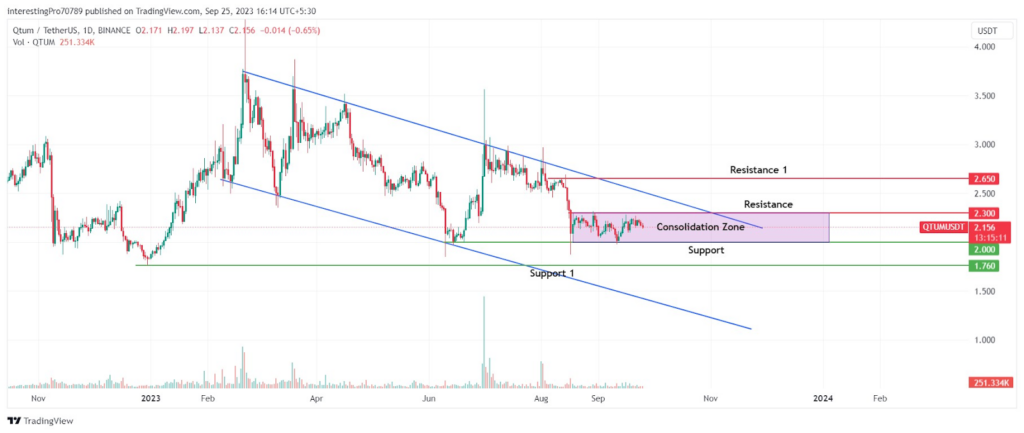
In the wider outlook of the chart, the price seems to be trading inside a parallel channel, the price has recently gotten stuck in a consolidation zone in a narrow range of $2.300 to $2.000.
The price has formed three back-to-back bearish candles and could continue its fall to the support of the narrow range. The price seems to be following a usual pattern. In which the price gets stuck in a range. After that, the coin price gives the breakdown of the range and starts to fall. The price has again repeated the same pattern.
So if the price again gives the breakdown of the range or the $2.000 level, it could be seen falling to its next support at $1.800. However, for the price to be bullish sentiment the price should give a breakout of $2.300, and the parallel channel then it may rise to $3.000.
Technical Indicators On the Current Trend
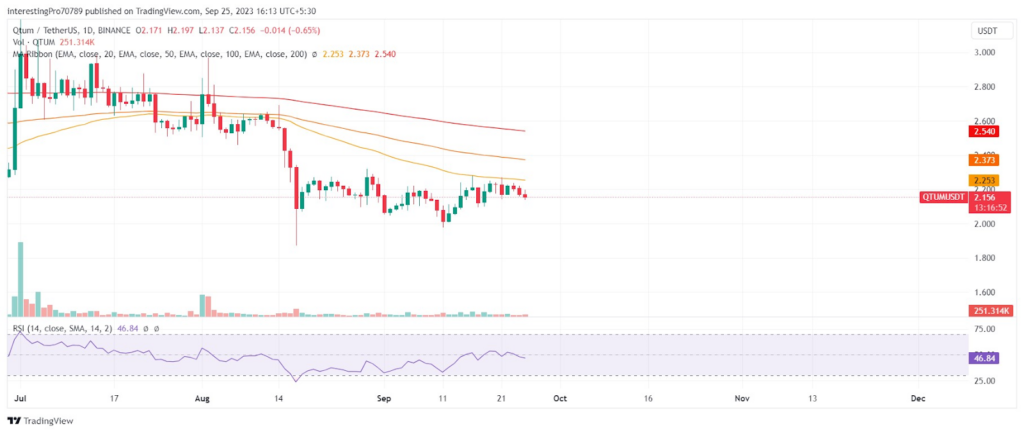
The QTUM coin price is below 50, 100, and 200 EMAs, indicating the bears’ control. It could fall if it stays below these moving average lines in the upcoming days.
The relative strength index is below 50 and has started to slope in the downward direction. This indicates that the sellers are more active than the buyers in the current scenario.
Conclusion
Overall, technical analysis shows that the QTUM coin is bearish at the time of writing. The coin price is in a continuous downtrend and is trading inside a falling parallel channel. Recently, the price has stuck in a narrow range of $2.300 to $2.000. All the indicators are pointing toward the bearish market.
So if the QTUM price again gives the breakdown of the range or the $2.000 level. Then it could be seen falling to its next support at $1.760. However, for the price to be bullish sentiment the price should give a breakout of $2.300 and the parallel channel, it may then rise to $02.650.
Technical levels
Resistance Levels: $2.300 and $2.650.
Support Levels: $2.000 and $1.760.
Disclaimer
The views and opinions stated by the author or any other person named in this article are for informational purposes only. They do not provide financial, investment, or other advice. Investing in or trading crypto assets comes with a risk of financial loss.




