
 NEAR Protocol
 Bitcoin
 Puffer
 Hyperliquid
 ZKsync
 Pudgy Penguins
 Pearl
Pearl
- The SUI coin price has been in a continuous downtrend.
- The price has recently given the breakdown of the $0.04670 level.
SUI is a proof-of-stake-enabled and permissionless protocol blockchain network that provides high throughput and quick transaction settlement. The coin recently debuted its Mainnet on May 3, 2023.
SUI Coin: Technical Analysis
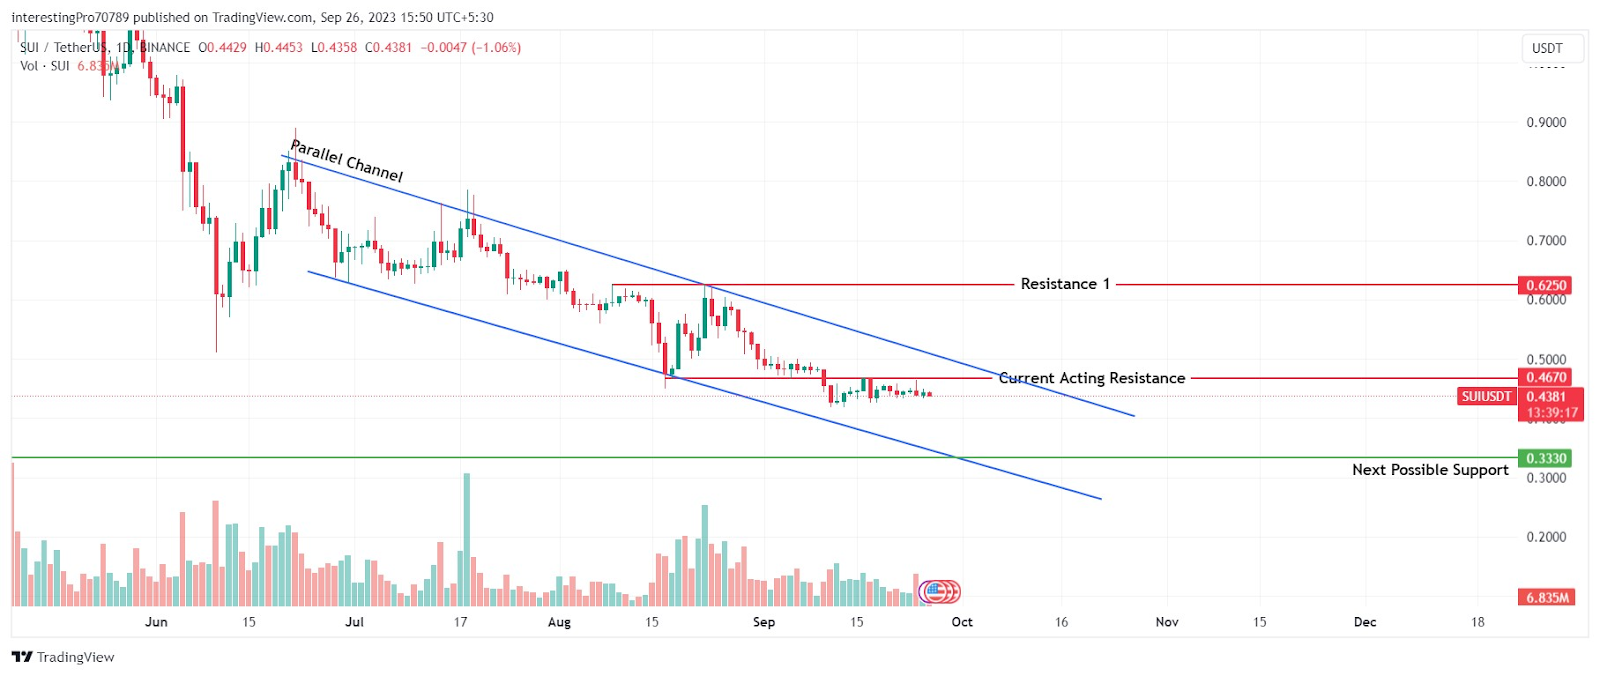
While analyzing the SUI chart on the 1-day timeframe, the coin price seems to forming a pattern of higher lows and lower lows. The coin also seems to be trading in a falling parallel channel. The coin price is also down by 0.95% in the last 24 hours.
Since the initial public offering (IPO) of the coin, the price has been in a downtrend. Every time the price formed support after sustaining above it for a small period, it gives the breakdown of that support level.
Recently, the price has given the breakdown of the support level $0.4670 and it is currently trading below it. The price has also formed a shooting star candle by taking resistance from the $0.4670 level. This shows the sellers are very active at that level and can make the price fall to its next possible support level at $0.3330.
However, for the SUI price to gain bullish momentum, the price should reclaim the $0.4670 level after which it may rise to $0.6250.
Technical Indicators On the Current Trend
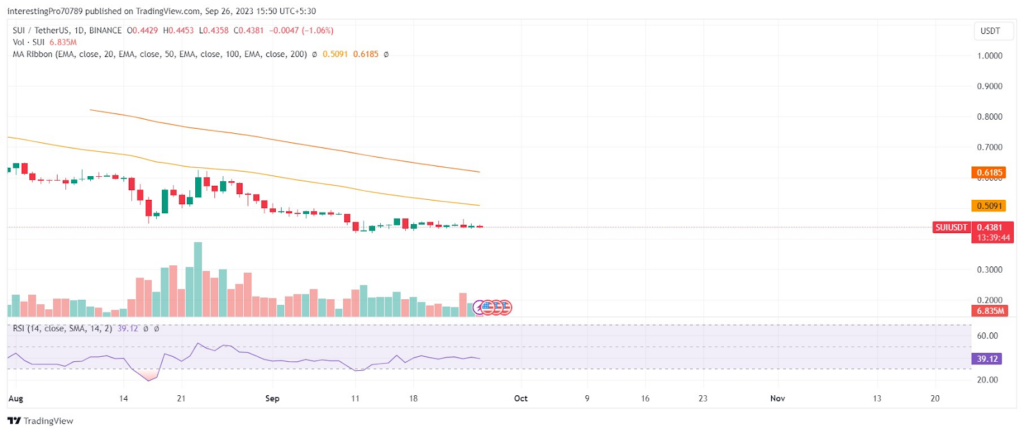
The SUI coin price is currently trading below the 50 and 100-day EMAs, indicating the sellers’ control over the price.
The relative strength index (RSI) is at 39.12 and it is currently sloping downwards. The RSI line points to bearish sentiments and indicates that there is more room for sellers to make the price fall.
The volume bar of the coin chart has also been continuously declining since the price has broken below the $0.04670 level.
The long/short ratio of the SUI coin shows that the long positions are slightly less than the short positions in the last 24 hours. The coin has experienced a 51.63% short position whereas the long position is 48.37% in the last 24 hours.
Conclusion
The SUI coin price has not shown changes or at the time of writing. The coin price is continuing its downtrend and is showing weakness day by day. The EMAs and RSI are pointing toward continued bearish momentum in the upcoming trading session. The price can be seen falling to its next possible support at $0.3330.
Technical levels
Resistance Levels: $0.04670 and $.
Support Levels: $ and $.
Disclaimer
The views and opinions stated by the author or any other person named in this article are for informational purposes only. They do not provide financial, investment, or other advice. Investing in or trading crypto assets comes with a risk of financial loss.




