
 hi
hi Boomer
 Lighter
 NEAR Protocol
 Covenant x402
 Pudgy Penguins
 Injective
- The APE coin has been facing a significant downfall for a long time.
- It is currently trading at $1.15 with an intraday rise of 3.12%.
- The token is down from its all-time high value by 97.16%.
The APE token has recorded massive losses of about 49.16% in the last 3 months and 72.45% in the last 6 months. The token marked this year’s high of $6.24 in the last week of January and since then the token has been in a downtrend.
The token’s price has also made a falling channel pattern from where the price broke below the falling channel. It broke the support level of $1.5, which will now act as a resistance for the price.
It is currently trading with a surge in the trading volume by 44.82% in the last 24 hours.
The token recorded its all-time high on 17th Mar 2022 when a single APE token was priced at $39.4.
The present circulating supply of the token is 368.59M APE, which is only 36.86% of its total supply. It has a current market cap of $423.11M. The 24-hour trading volume of the token is $59.32M.
Sentiment Analysis
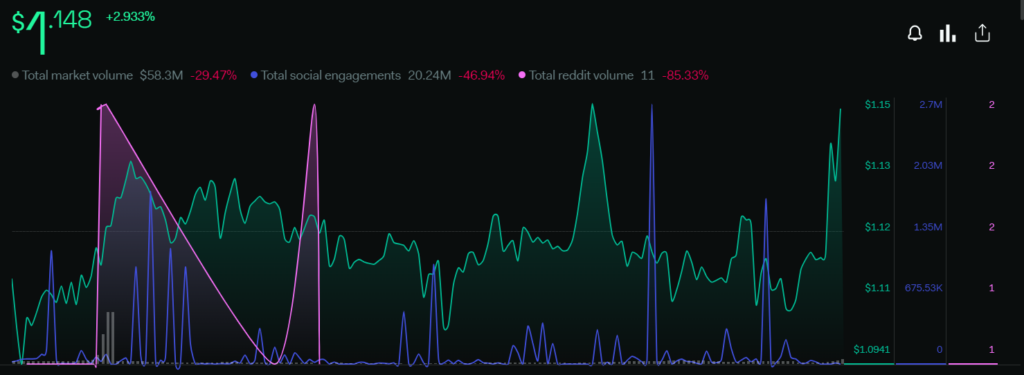
The price of the token has increased by 2.93% in the last 1 week and the total volume of the token has declined by 29.47%. It shows that there is no such buying activity going on in the market of the token.
The total social engagements have dropped by 46.94% and the total Reddit volume has also decreased by 85.33%. It shows the social community of the token is currently not engaging actively.
The overall sentiments are negative and indicate a bearish movement in the price.
Technical Analysis (Daily – 1D):
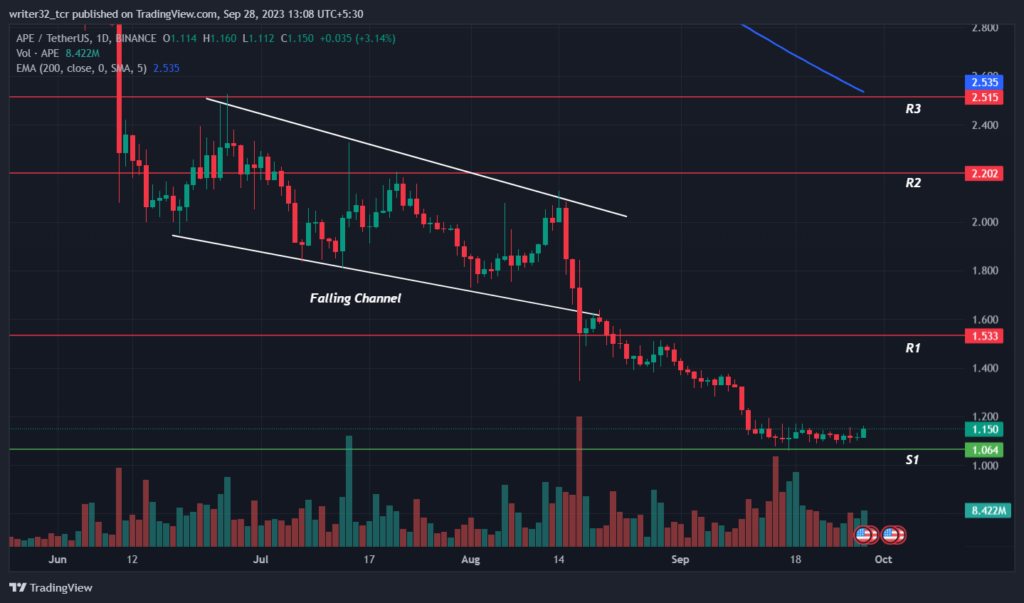
As we can see in the chart, the price made a falling channel pattern from where the price broke down below and also broke the support level of $1.5. That support will now act as resistance. The price is currently trading at the support level of $1.
If the price has to reverse the trend and move upwards. It needs an immense amount of volume. Its social community has to be active where the bullish investors have to be dominant and keep the price moving up.
The first target will be the break of $1.5 and regaining it as a support level. The further targets will be $2.2 and then $2.5. Further targets can be achieved based on how the volume of the token plays the game.
Relative Strength Index (RSI)
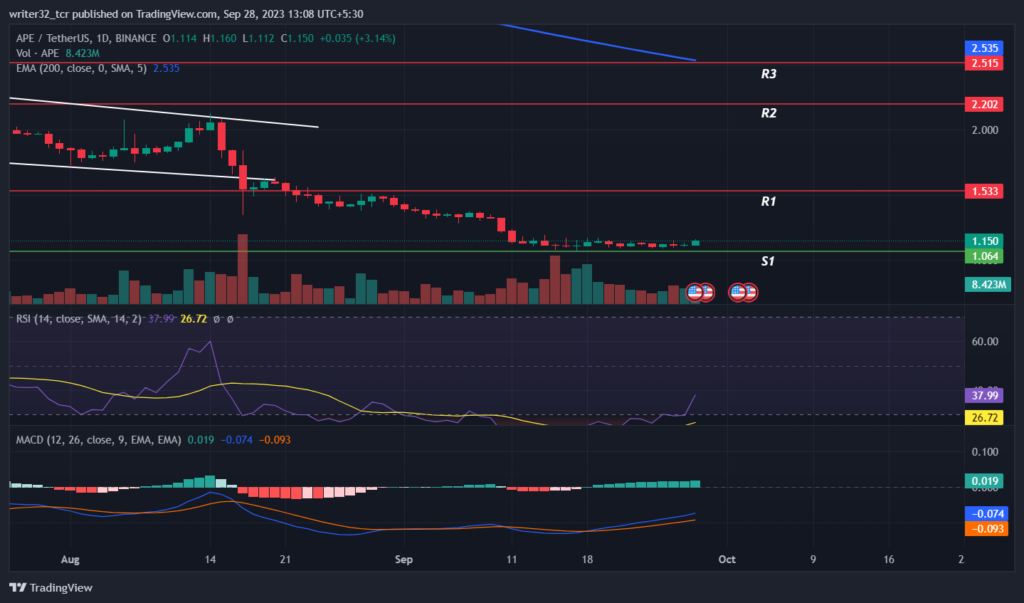
The RSI line is presently moving at 37.99 points and the SMA 14 is moving at 26.72 points. The RSI is currently below the neutral level of 50 and under the oversold region, which shows a bearish movement in the price.
Moving Average Convergence/Divergence (MACD)
The fast blue line moving average is moving above the red slow line moving but under the average level of 0. The volume in the histogram is showing low volumes, which is also a reason for a bearish price.
APE LIVE CHART :
Conclusion
The price is currently under a bearish trend, where the volume and social community are not showing any major move actions. We should wait for the price to give some major move. If the price has to be bullish, the volume of the token has to surge and the bullish investors have to take over.
If the social community stays inactive and the volume keeps on falling, the price can fall further and reach its all-time low again.
Technical Levels
Support: $1
Resistance: $1.5, $2.2 And $2.5
Disclaimer
The views and opinions stated by the author, or any people named in this article, are for informational purposes only and do not establish financial, investment, or other advice. Investing in or trading crypto assets comes with a risk of financial loss.




