
 Quack AI
 NEAR Protocol
 Lighter
 Bitway
 Pearl
Pearl Quantus
 Sui
Sui
- The IHS stock price is currently at $5.17 while observing an increase of 0.58% during the intraday trading session.
- The IHS Holding Ltd stock price declined by -48.27% since last fall.
IHS Holding Limited (NYSE: IHS) is one of the largest telecommunication infrastructure providers in the world, and it was founded in the year 2001. It provides its telecommunication infrastructure services to mobile network operators (MNOs) as well as other customers.
IHS Holding Ltd (NYSE: IHS): Technical Analysis
The stock price is currently at $5.17 while observing an increase of 0.58% in the intraday session, with an average volume of 450.11k and a decrease of -29.56% during the one-month trading session. The current market capitalization of the stock stands at approximately $1.73 Billion. The day range of the stock price is between $4.85 to $5.25.
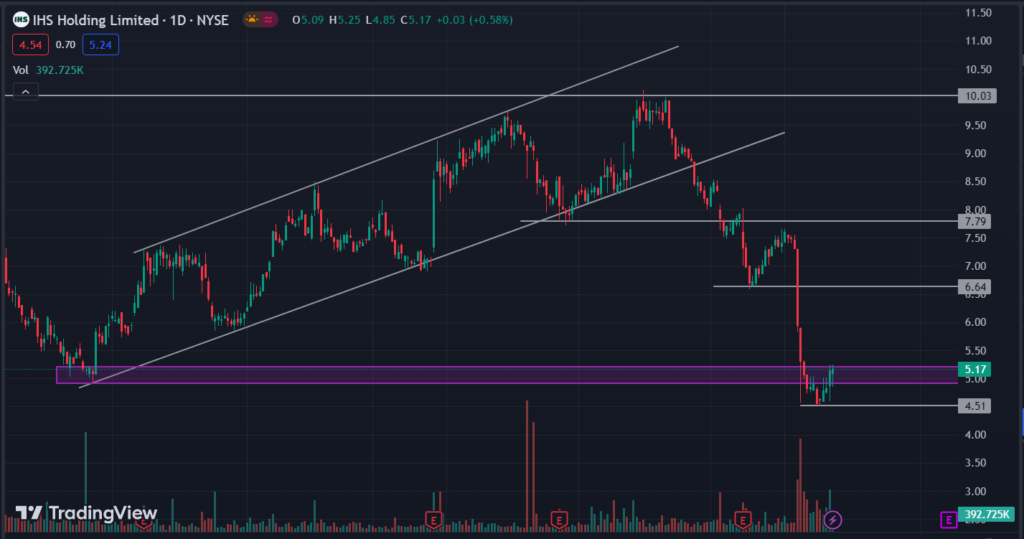
On June 30, 2023, the stock price started a bearish rally from the resistance level at $10.03 and dropped almost -55.33% to the previous support of $4.91. Following this decline, the price is currently moving to retest the $6.64 resistance level.
The price is currently trading near the $4.91 support level which started the uptrend momentum until it reached $10.03. In the last four trading sessions, the price has formed multiple bearish candles at $4.51 reflecting the buyers’ presence at this level.
The price successfully made a new lowest point at $4.51. Right now, the price is moving toward the resistance levels. If the price gets support at the $5.03 level after the retest, then the price may be seen rising up to $7.79. On the other hand, for the price to continue its bearish momentum it should close below the $4.51 level.
Technical Indicators On The Chart
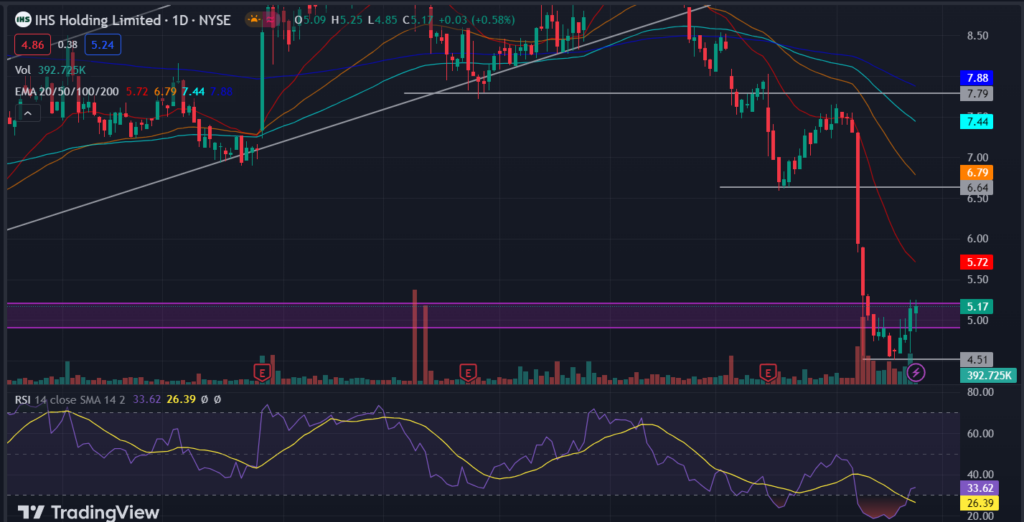
The IHS stock price is trading below 20,50,100 and 200-day EMAs, indicating bears’ dominance over the price.
The relative strength index (RSI) is currently trading at 33.62, and it has recently faced rejection from the lower band around the 30 mark. This rejection suggests an increase in bullish participation in the market. However, it’s important to note that the RSI is still below the 50 mark, indicating that the bulls do not have enough strength at the moment.
Conclusion
The overall price structure of IHS stock is bearish. The stock price is trading slightly above the previous support level at $4.91. If the stock price took support at $5.03 after retesting the $6.64 level, then the price may rise up to the $7.79 level. However, for the price to continue its bearish rally it should close below $4.51.
Technical levels
- Resistance Levels: $5.96 and $6.64
- Support levels: $4.51
Disclaimer
The views and opinions stated by the author, or any person named in this article, are for informational purposes only. They do not establish financial, investment or any other advice. Investing in or trading stocks comes with the risk of financial loss.




