
 streamoors
 IGNITION
 Injective
 NEAR Protocol
 Pearl
Pearl LayerZero
 Hyperliquid
- Marsh & McLennan is going to release its financial report on 19 October.
- Marsh & McLennan stock has surged by over 25% in a year.
- Rating firm Jefferies maintained its hold call with a target price of $206.55.
Marsh & McLennan (NYSE: MMC) stock has closed its previous trading session with a slight decline of $0.46 or 0.24%. The Marsh & McLennan stock is currently trading at $192.62, which is very close to its 52-week high level, which is also an all-time high level for the stock. Currently, the stock price seems to form a base at the upper level, which is a good sign for the company.
The Marsh & McLennan stock price was forming a base between the levels of $175 to $140 for more than a year. The stock price ended this consolidation in April 2023 when the price breached the resistance level of $175. It has shown a great uptrend which started in March 2023 and since then, the stock has surged by over 25%.
MMC stock currently seems to form a base at the upper level for the next move. It has been trading in a range between $187 and $198. The underperforming revenue and income growth could be a reason for this consolidation.
An Outlook of the Marsh & McLennan Stock Chart
Marsh & McLennan stock has been in a strong uptrend till now, but this momentum was halted in September 2023. The MMC stock price is currently trading above the 50-day and 100-day exponential moving averages (EMAs), which is a bullish sign. However, the stock has tried to breach the 50-day EMA but failed miserably. MMC stock is taking support from the 50-day EMA after rebounding from the 100-day EMA.
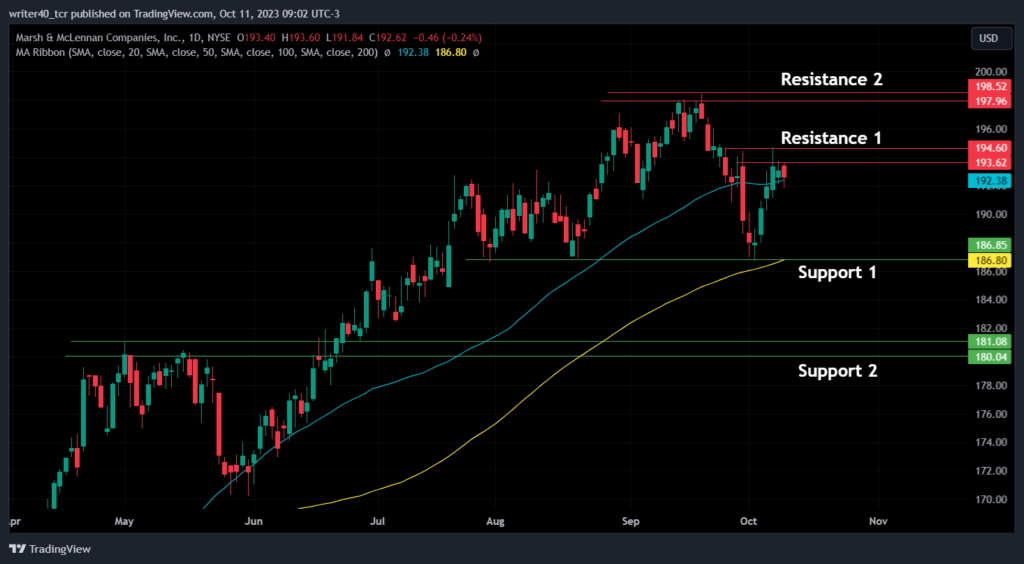
MMC stock is consolidating which means that the stock price has created some demand and supply zones. The stock has recently formed a new supply zone near the level of $193.62. Apart from this, the other resistance level is present at the level of $197.96. If we consider the demand zone, $186.80 is acting as a crucial demand zone. $181.08 can also provide some demand to the stock.
A Short Glimpse of the Indicators
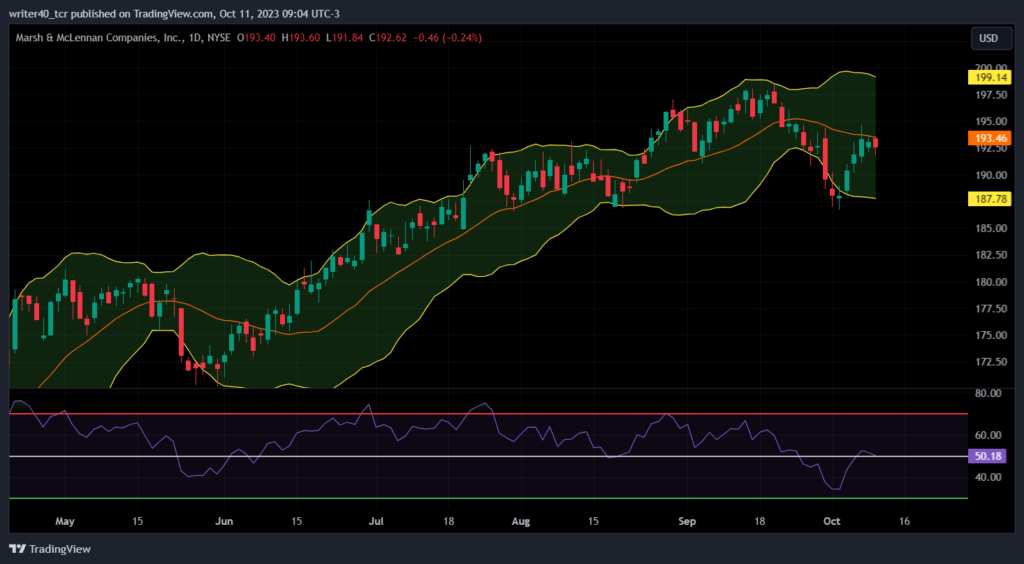
The Bollinger Bands is currently not favoring anyone, as it is neutral right now. The RSI is also stating the same about the stock price.
Bollinger Bands
The MMC stock price initially closed below the lower band of the indicator but soon entered inside the band. This is an indication of bullishness. However, the stock is trading very close to the median line of the indicator and has recently faced rejection from it. This created confusion about the stock and it is favoring neither side right now.
Relative Strength Index
The relative strength index (RSI) is currently placed just at the 50 level which is also a neutral signal. However, the slope of the RSI is upward which is a good sign for the bulls.
Conclusion
The MMC stock price is awaiting a breakout on either side. If the stock price is able to break the resistance level of $193.62, then it may move towards the $197.96 level. If it breaks the support level of $186.80, then it can try to reach the $181.08 level.
Technical Level
Resistance – $193.62 and $197.96
Support – $186.80 and $181.08
Disclaimer
The views and opinions stated by the author, or any people named in this article, are for informational purposes only. They do not establish financial, investment, or other advice. Investing in or trading crypto assets comes with a risk of financial loss.



