
 Boomer
 Covenant x402
 Claudia
 Pearl
Pearl Quantus
 Bitcoin
 NEAR Protocol
- JP Morgan Chase & Co’s MACD indicator is forming a positive crossover.
- JP Morgan Chase & Co. stock has a dividend payout ratio of 25.7%.
- The JP Morgan Chase & Co.’s profit margin percentage is rising.
JPMorgan Chase & Co. (NYSE: JPM) operates as a financial holding company, primarily involved in delivering comprehensive financial and investment banking solutions. The company provides a diverse array of financial products and services across various capital markets.
The price of JP Morgan Chase and Co. (JPM) stock is currently following an upward trajectory, characterized by the formation of higher highs. This pattern indicates a robust bullish trend in the price of JPM stock.
Over the past year, the price of JPM stock has experienced a significant increase of 40%, underscoring its current upward momentum.
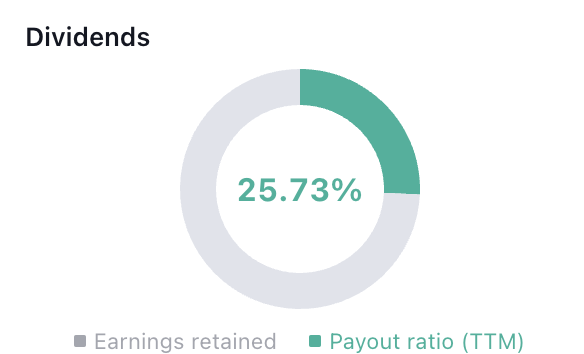
The dividend payout of JPM stock is 25.7% and the dividend yield is 0.74%. The company pays a timely dividend to its shareholders. This represents a strong financial position.
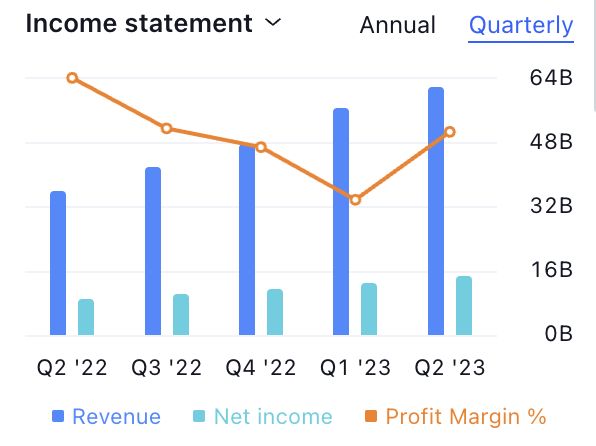
Furthermore, the quarterly profit margin percentage of the company has been steadily increasing. In Q1 2023, it was at 22.3%, and by Q2 2023, it rose to 23.5%. This uptrend in profit margin reflects the company’s strong financial position.
While JPM stock reached a high of $159 in July 2023 and subsequently experienced an 11% decline, it found support at the $141 level, leading to a price rebound.
The overall structure of JPM stock is forming a robust pattern, suggesting a potential price increase in the coming days.
JP Morgan Chase and Co. (JPM) Technical Analysis
JPM by writer50_tcr on TradingView.com
Technical Indicators’ Summary:
The MACD line is positioned above the signal line, accompanied by the formation of a green histogram. This configuration suggests that the stock is currently in a bullish phase, implying potential price increases in the upcoming days.
The RSI line for JP Morgan Chase & Co. stock is above the SMA line. This is a positive indicator for the stock, increasing the likelihood of the stock price rising.
Conclusion
JP Morgan Chase & Co. (JPM) stock exhibits an upward momentum, characterized by the formation of a pattern of higher highs in its price. The stock’s positive performance and consistent dividend payout of 25.7% further support the notion that JPM’s price is poised for potential future increases.
Technical Levels
- Support Level: $143
- Resistance Level: $157.6
Disclaimer
The views and opinions of the author, or anyone named in this article, are for informational purposes only. They do not offer financial, investment, or other advice. Investing or trading crypto assets involves the risk of financial loss.




