
 Quack AI
 Quant
Quant Pudgy Penguins
 Ondo
Ondo NEAR Protocol
 Starknet
 Bittensor
- Truist Securities maintained its Buy rating on the Verisk Analytics Stock.
- Verisk Analytics is very close to its All-Time High Level.
- Verisk Analytics has shown strong financial growth over the years.
The Verisk Analytics stock is in a strong uptrend, as the price has not shown any major correction. It has been forming a base between 2020 and 2022, near the level of $160. On the broader time horizon, the stock has performed very well, as it surged by over 800% since the listing. This kind of performance by any stock enhances the trust of investors.
Verisk Analytics stock has been rated by Truist Securities, the rating firm has maintained its buy rating. It has raised the target price of the Verisk Analytics stock from $270 to $275. The stock price has been rising sharply since February 2023. It seems like the buyers are not in the mood to stop.
Verisk Analytics stock has been rising without breaking the previous swing low, which indicates that the trend is super strong. The company has performed well in its financial aspect, as it has shown a noticeable growth in its profit. It is maintaining its net debt perfectly, as the net debt has been in the same range for years.
Synopsis of the Verisk Analytics Stock Chart
VRSK stock has given a strong breakout from the Symmetrical triangle pattern in the month of March. It has perfectly retested the breakout level, which validated that the breakout is genuine. The stock price has created a strong demand zone at this level i.e. $186.85. It has shown a huge jump from this level and formed a gap on the daily chart. Currently, the stock has been forming doji candles for 3 days. That indicates the investors are indecisive.
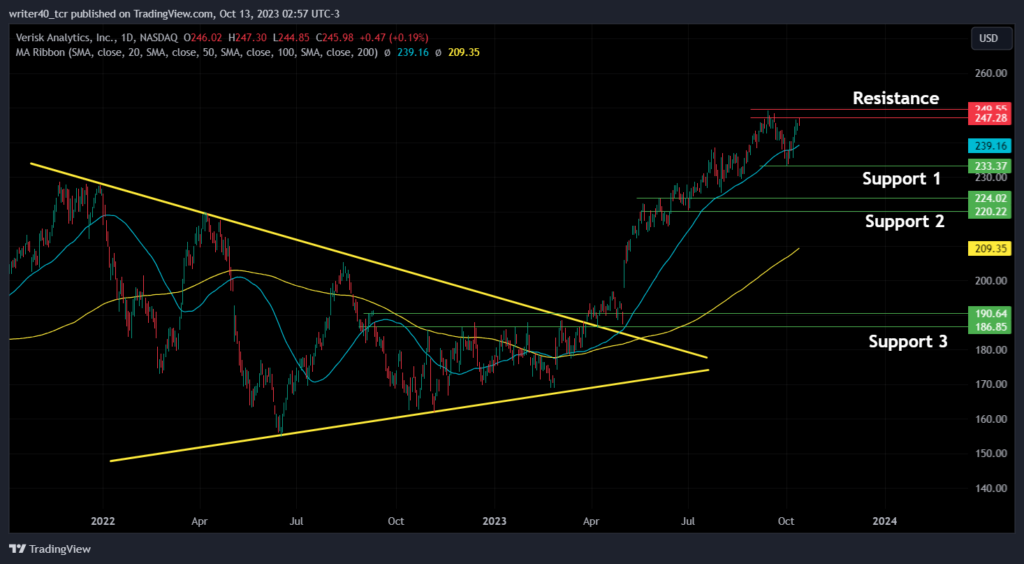
VRSK stock has been trading well above the 50-day and 200-day Exponential Moving Averages, which is a bullish sign. The stock has witnessed a golden crossover at the beginning of March 2023. In this uptrend, the stock has created some supply and demand zones. The supply zone is present at $247.28 and $249.26 level. Furthermore, the support level is present at $233.37 and $220.22.
Glimpse of the Indicators
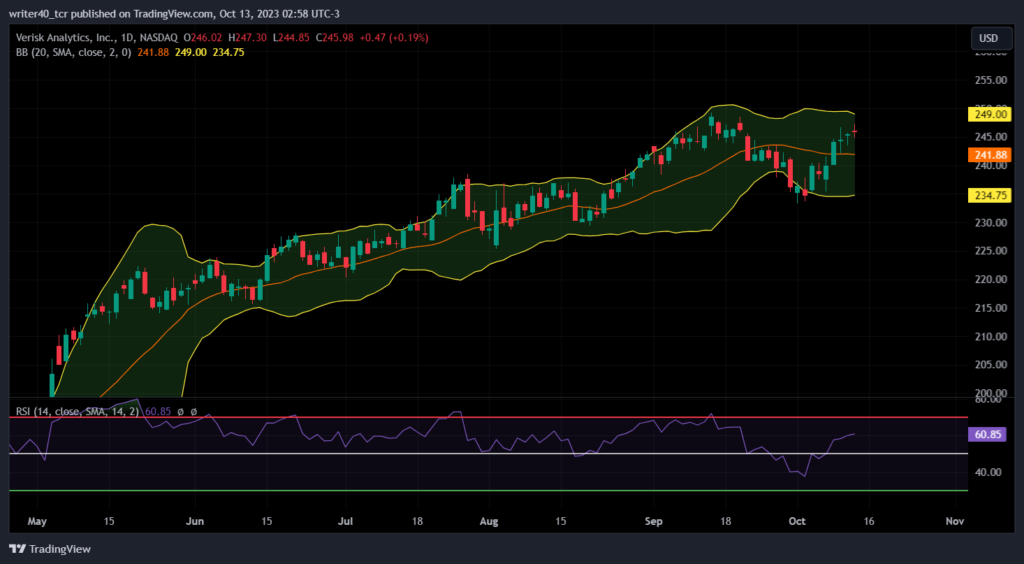
VRSK stock’s recent movement has created a range on the Bollinger Band and seems like it will get flattened soon. It indicates that the stock can witness some range-bound trading and less volatility in the coming days. However, the Relative Strength Index’s curve is showing that the bulls have gained some strength. It is currently placed well above the halfway line.
Conclusion
VRSK stock price is currently attempting to clear the recent swing high of $249.26 level. However, if we notice the recent candles, it is clearly visible that the buyers are struggling to push the price up. The $233.37 level will act as support for the price if the price reverses from this level.
Technical Level
Resistance – $247.28 and $249.26
Support – $233.37 and $220.22.
Disclaimer
The views and opinions stated by the author, or any people named in this article, are for informational purposes only. They do not establish financial, investment, or other advice. Investing in or trading crypto assets comes with a risk of financial loss.




