
 Quack AI
 NEAR Protocol
 Pudgy Penguins
 Pearl
Pearl Quant
Quant Quantus
 Sui
Sui
- The BTG price is trading at $13.23, witnessing a decrease of 2.32% in the intraday session.
- BTG is trading above the 50-day EMA and below the 200-day EMA.
- The price is moving sideways between the levels of $12.1 to $13.7.
The BTG coin marked its yearly high at the end of July and since then price has been bearish. The price has been giving a lateral movement for the last 3 months. The bulls of the tokens market are also getting significant rejections from the 200-day EMA. It has to break its sideways motion for a major upward or downward movement. The price has to move above the 200-day EMA and sustain to get an adequate upward move.
It marked an all-time high of $539.72 on October 24, 2017, and since then the token has been down by 97.52% from the all-time high. During this high, the market cap of the token was at 6.57 Billion.
Presently, the daily trading volume has increased by 41.27% in the last 24 hours. The circulating supply of the token is 17.51 Million, which is 83.40% of the total supply. It also has a current market capitalization of $230.74 Million.
Sentiment Analysis
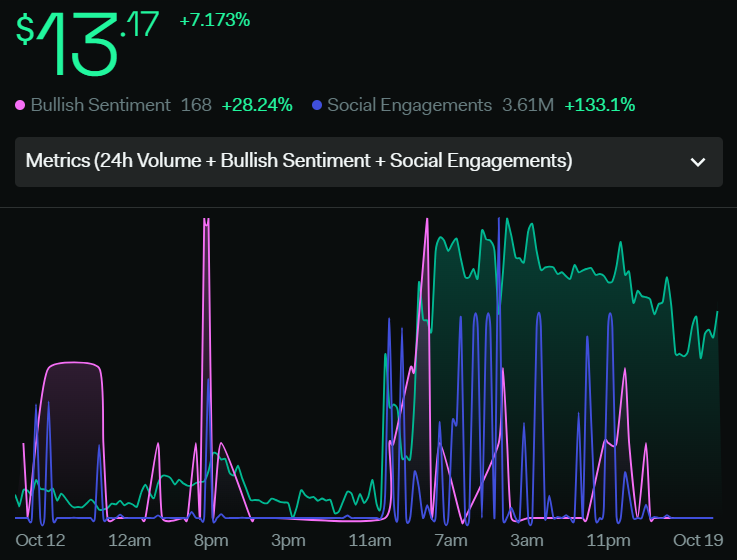
The surge of total trading volume metric by 188.8% within a week resulted in an increase in the price by almost 15%. Total social engagements grew by 133.1% showing the activeness of the social community. Following this positive change, the bullish sentiment metric also surged by 28.24%.
Technical Analysis of the BTG Coin (Daily-1D)
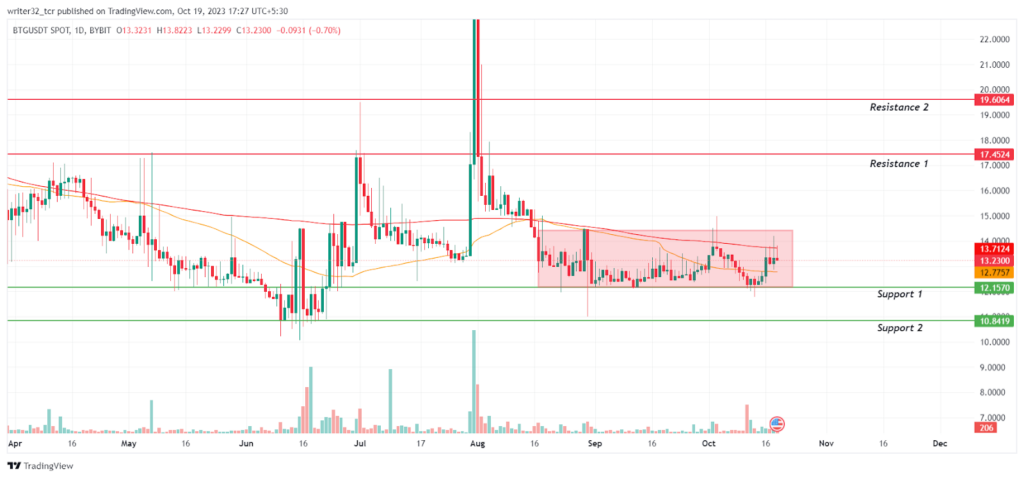
The price is again getting rejected from the 200-day EMA. Bulls have to be more dominant to take the price above the EMA and sustain above it. That is essential for an upward move from $16 to $17. For breaking the sideways trend the price has to break the $14.5 level.
If bulls fail to maintain the price above and the price and the coin value gets successful rejection again from the 200-day EMA, then it can fall to the support level of $12.1 or further to $10.8.
Indicators On The Price Of BTG
Relative Strength Index (RSI)
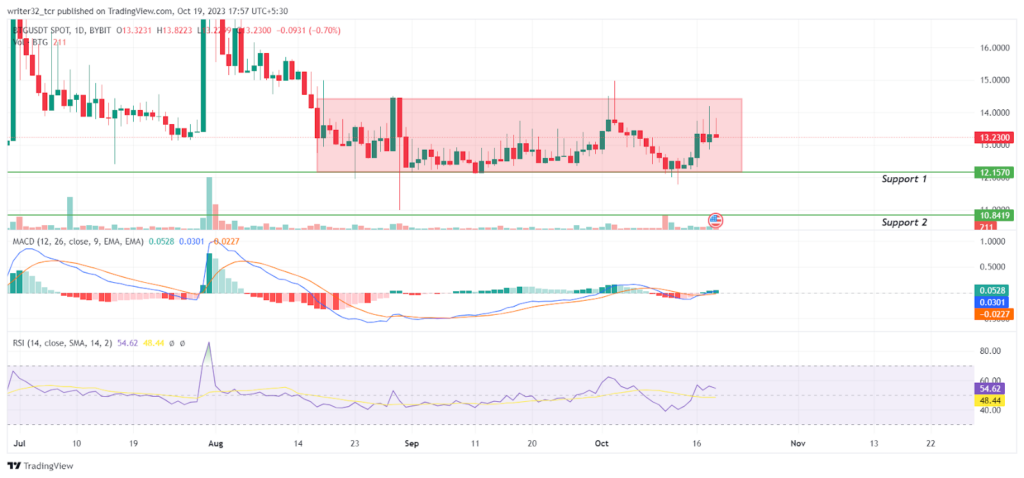
The RSI is moving on the neutral level at 54.93 points and SMA14 at 48.47 points, indicating a consolidation phase of the price. Once the price breaks its sideways move, it can give a good upward move.
Moving Average Convergence/Divergence (MACD)
The fast blue line moving average is moving above the red slow line moving average. The red slow line moving average is again trying to cross above the fast blue line moving average, which can be a bearish sign. Histogram is representing a bit of rise in the volume, which can be a positive if it increases significantly.
BTG LIVE CHART
Conclusion
The price action and market structure of BTG price suggest that the price has to break its sideways movement and break the level of $14.5 for a major movement in the price. Until the price gets above the 200-day EMA and sustains, it will be considered bearish.
Technical Levels
- Support Level: $12.1 and $10.8
- Resistance Level: $17.4 and $19.6
Disclaimer:
The views and opinions stated by the author, or any people named in this article, are for informational purposes only and do not establish financial, investment, or other advice. Investing in or trading crypto assets comes with a risk of financial loss.




