
 Bitcoin
 Quack AI
 Pudgy Penguins
 Quantus
 Solana
 Injective
 NEAR Protocol
- The BTT coin is trading at 0.000000378 with a surge of 1.32% in the intraday sessions.
- The token started its bearish downtrend after marking its yearly high in February.
- The price is trading below a bearish trendline.
The BTT token price has recorded a negative ROI of 20.19% in 3 months and 40.61% in the last 6 months. It is currently trading below the 50-day EMA and the 200-day EMA. The bearish phase shows that investors are not taking much interest in the token as the token got delisted from major exchanges like Binance and Huobi. It is trying to break the bearish trendline but getting rejected from the top of the trendline and the 50-day EMA.
Over the past few months, the price has not shown any upward movement. The major reason for the downfall of the BTT coin has been its losing interest of people in its own community for a long time.
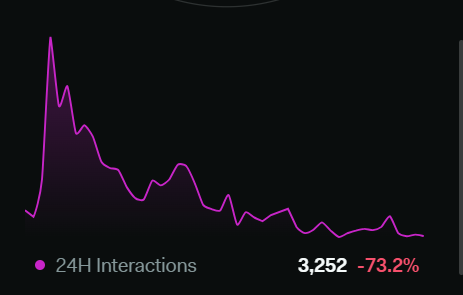
The 24-hour interactions on the post have declined by 73.2%. The average interaction decrease on every post has reached 80%.
It marked an all-time high on 18th January 2022, when the token was priced at $0.000003054. During this high, the market capitalization of the token was at 2.66 Billion. The token is down by 87.66% from the all-time high.
Currently, the circulating supply of the token is 951.42 Trillion BTT, with a market capitalization of $359.70 Million. The 24-hour trading volume of the token is 12.90 Million which has increased by 13.6%.
Technical Analysis Of The BTT Token (Daily-1D)
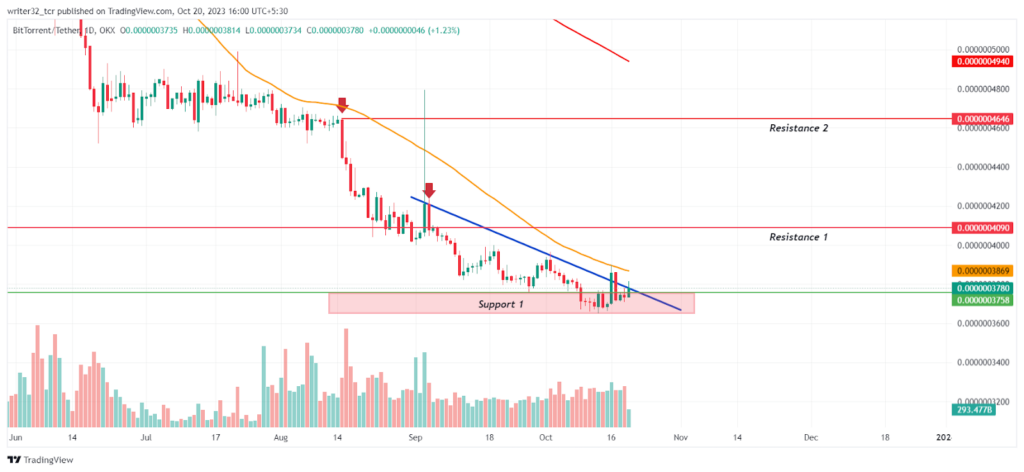
The price of the BTT token is trying to break the bearish trendline but still getting rejected. The only way the price can be bullish is when the price breaks above the trendline and crosses the 50-day EMA for a short-term upward movement.
However, If the price still gets rejected from the trendline, then the price can lose its support level of $0.000000365 to $0.000000375 and fall down further.
For a major upward movement, the investors of the community have to be active and the bulls of the market have to be dominant on the resistance levels to diminish the bearish investors. If this happens and the price crosses above the 200-day EMA at $0.0000004940 and sustains, it can give a major bullish move to the price.
Indicators On The Price Of BTT Token
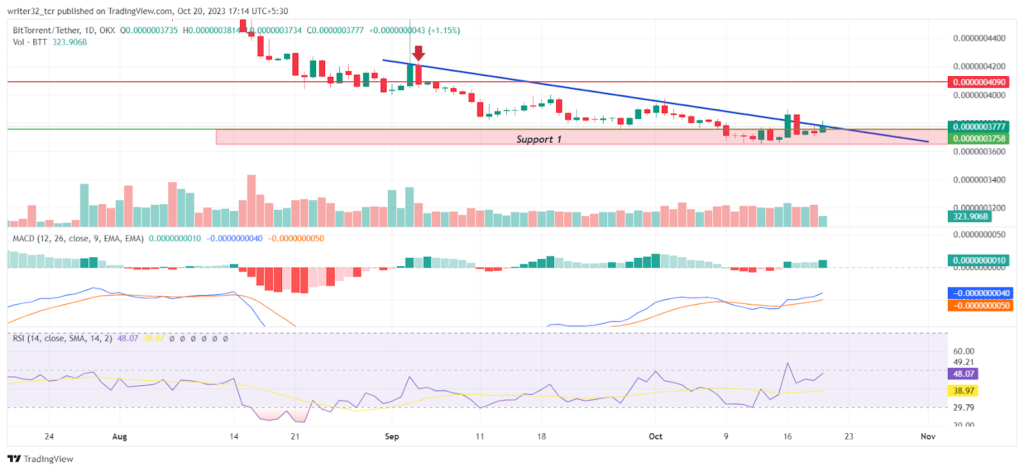
Relative Strength Index (RSI)
The RSI line is moving at 48.07 points and SMA 14 at 38.97 points, Both are below the neutral level of 50. RSI is moving above the SMA 14 which shows that bulls are getting in strength.
Moving Average Convergence/Divergence (MACD)
The fast blue line moving average is moving above the red slow line moving average, The histogram is showing some increase in the volumes which is a positive sign towards an upward move.
BTT LIVE CHART
Conclusion
The analysis of the market structure and price action of the BTT token suggests that the token can be bullish till $0.0000004090 after breaking the trendline. However, if the price gets reject again from the trendline, it will continue its bearish trend.
Technical Levels
- Support Level: $0.000000365 to $0.000000375
- Resistance Level: $0.0000004090 and $0.0000004646
Disclaimer:
The views and opinions stated by the author, or any people named in this article, are for informational purposes only and do not establish financial, investment, or other advice. Investing in or trading crypto assets comes with a risk of financial loss.




