
 streamoors
 IGNITION
 Injective
 Quantus
 NEAR Protocol
 Pearl
Pearl LayerZero
- The market estimate of the First Foundation stock is on the negative side.
- The First Foundation stock price is down by over 35% in the last 1 month.
- This stock’s average price forecast is $8.80.
The First Foundation stock price has declined by over 9% on 20 October 2023. It is currently on a 3-day losing streak, as the price has fallen by over 14%. The First Foundation stock is soon going to post the quarterly financial report. The market is expecting that the company will post the result on the negative side.
The first foundation stock price has been in a downtrend since November 2021. It has declined by over 83% in this downtrend which is massive. If we consider the fall this year, this stock has fallen by over 65% which is huge. However, the stock has tried to show some reversal in the middle of this year. It has surged by about 30% from the lows.
First Foundation stock has been rated by several analysts and the average target price is near the level of $8.80. It is still about 77% below the average target price which is a positive thing for the bulls. It can boost the price in the future and if the stock rises from here it can become a good swing call opportunity for the buyers.
An Overview of the First Foundation Stock Chart
FFWM stock price has recently broken the support level of $5.50. It has been a strong bearish grip, as the stock price has declined by about 41% since September 2023. If we observe this fall, it is clearly visible that the bears are strongly dominating the bulls and have shown no strength so far since September 2023. In the last two trading sessions, the stock price has formed some bullish reversal candles. The buyers have absorbed the liquidity and are trying to push the price up.
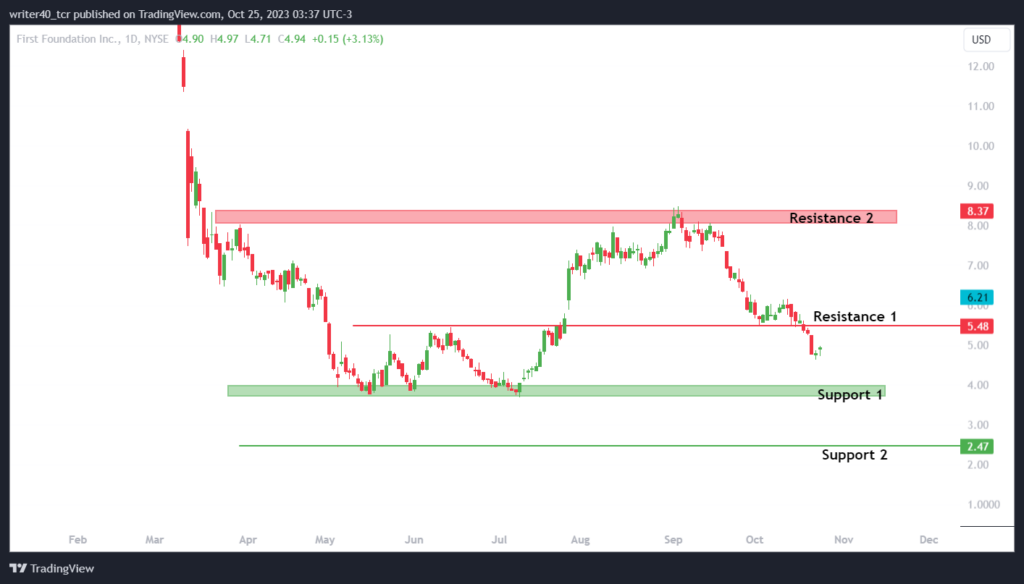
The previously broken support i.e. $5.50 will now act as resistance for the stock price. Apart from this the $8.50 can also provide some resistance to the price. Considering the support level, the first support is present at the level of $3.80 and the other support is present at the level of $2.47.
An Outlook of the Exponential Moving Average and Relative Strength Index Indicator
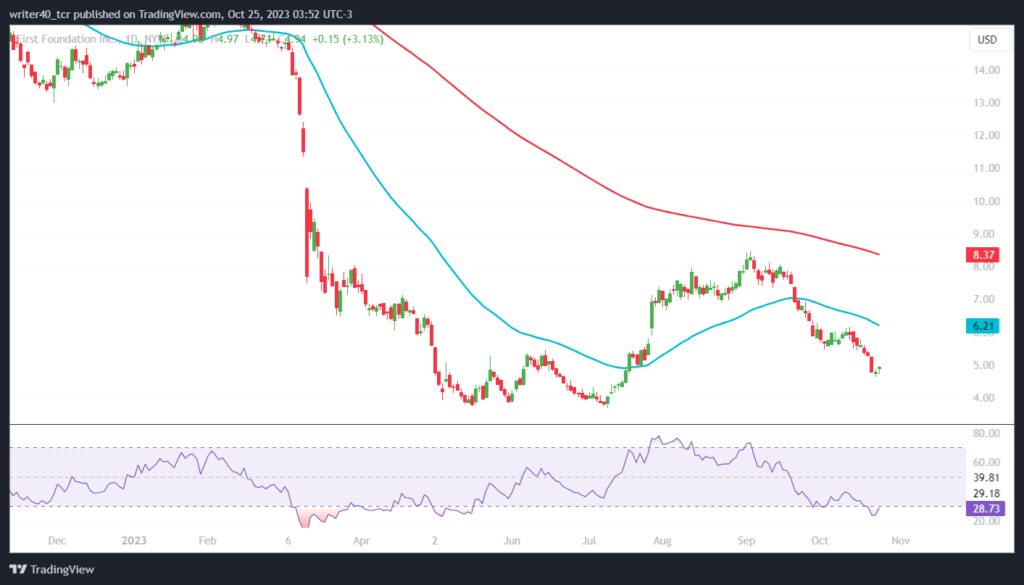
FFWM stock price has been struggling to cross the 50-day Exponential Moving Average and is trading far below of the same. 200-day Exponential Moving Average is present at the level of $8.37 which can provide some resistance to the price. Considering the Relative Strength Index, it is curving at the level of 28.73 which is considered as the oversold trajectory.
Conclusion
The FFWM stock price is currently trading in a downtrend and is showing some reversal signs at present. The RSI is also at an oversold trajectory indicating that the price can reverse from here. If the price rises, it can try to achieve the level of $5.50 and $8.50. However, a continuation of a downtrend can lead the price to the level of $3.80 and $2.47.
Technical Level
- Resistance – $5.50 and $8.50
- Support – $3.80 and $2.47
Disclaimer
The views and opinions stated by the author, or any people named in this article, are for informational purposes only. They do not establish financial, investment, or other advice. Investing in or trading crypto assets comes with a risk of financial loss.



