
 Minter
 Quack AI
 NEAR Protocol
 Pearl
Pearl Sui
Sui Pons
Pons Quantus
- Morgan Stanley has increased the target price of the Arch Capital Group Ltd. from $98 to $100.
- Arch Capital Group Ltd.’s stock price is trading in a rising channel pattern.
- The ACGL stock price has surged by over 63% in a year.
Arch Capital Group Ltd Stock’s price has been a trustable investment for the investors. It has surged slowly and steadily for a few decades and became a multi-bagger stock for investors. The stock has witnessed a massive fall for the first time in the year 2020 and that too because of the COVID-19 pandemic fear. It has slipped by about 55% during the Corona sell-off.
The Arch Capital Group Ltd. stock price resumed its uptrend in the middle of 2020. Since then, the stock price has surged by more than 287%. Currently, it is in the same uptrend it started back in 2020. It has not gone for any deep correction in between and stock price has been rising gradually over time.
Morgan Stanley has maintained its previous rating of “OVERWEIGHT” on the Arch Capital Group Ltd Stock. It has increased the target price of stock to $100, which was set to $98 in the past. Wall Street expects that the company can report strong earnings in the upcoming quarterly results.
Synopsis of the Arch Capital Group Ltd Stock Chart
The ACGL stock price has been rising in a rising channel pattern and looking super strong. It has been a year since the price has been following this pattern and is not looking weak enough to fall. However, the angle created by the stock is not a bullish pattern. It is expected that the stock price can break the level on the downside and it can sustain for some time.
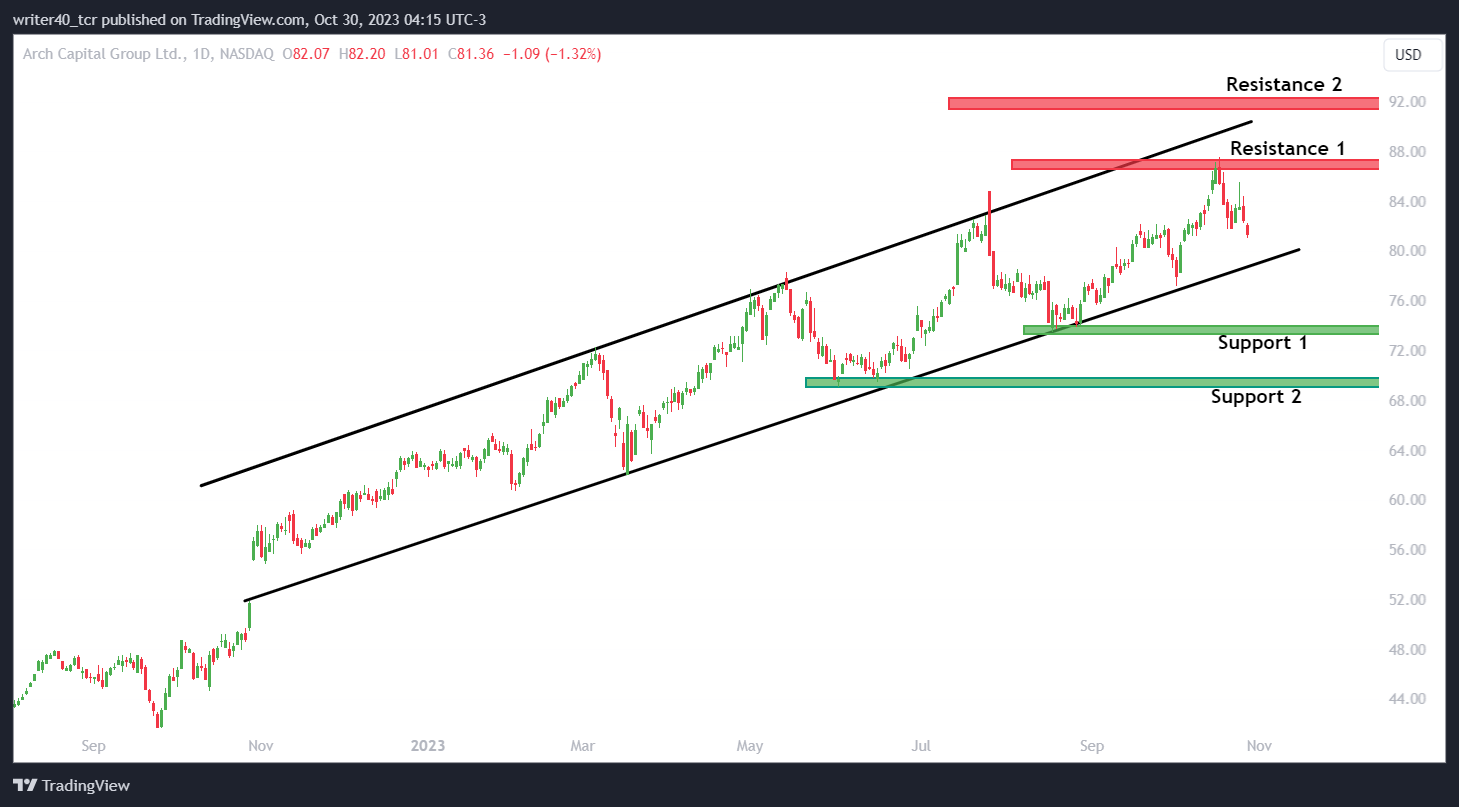
The trendline resistance of the pattern is present near the level of $91.10 and the support of the trendline is present near the level of $78.80. The price is at its ultimate high level and it can face resistance near the recent swing high level of $87.51. Apart from this, the price can face resistance near the Fibonacci-based resistance of $92.20. Considering the support levels, they are present at $73.22 and $69.10 levels.
An Overview of the EMAs and Relative Strength Index
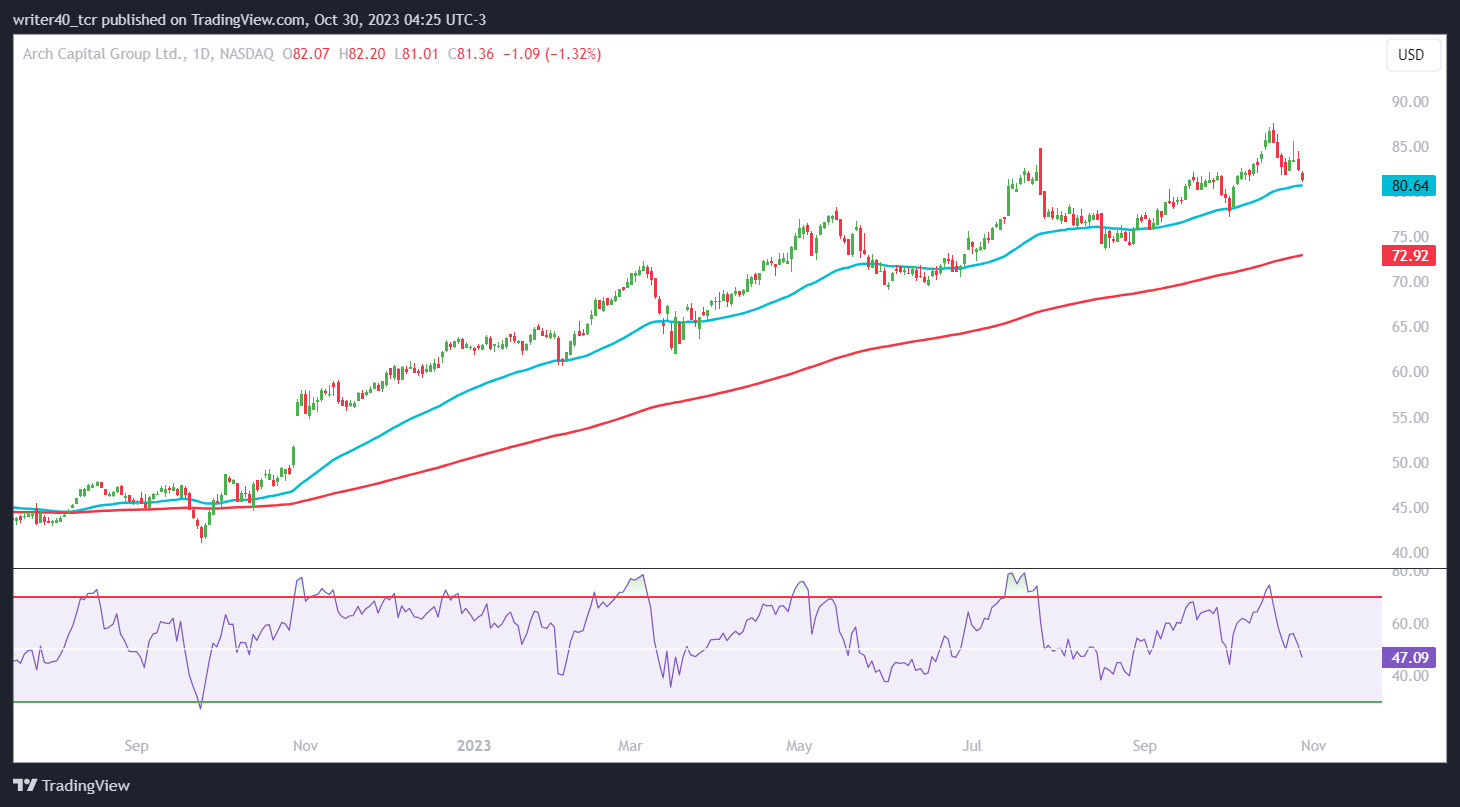
The stock price is trading above the 50-day Exponential Moving Average. It has taken support from the 50-day EMA, which is a bullish sign. There is a big gap between the 50-day and 200-day EMAs. It indicates the bulls are in a strong momentum. The relative strength index is currently placed at 47.09 level, which shows that the current momentum favors none. However, the slope of the RSI is steep and that is a sign of bearish momentum.
Conclusion
The stock price is in a strong uptrend and this trend can continue further. The company is going to release the earring reports soon. It is expected that the report will show a growth in its financial tally. However, if Arch Capital Group Ltd fails to deliver the growth in line with the market estimate, its stock price can fall.
Technical Level
Resistance – $87.51 and $92.20
Support – $73.22 and $69.10
Disclaimer
The views and opinions stated by the author, or any people named in this article, are for informational purposes only. They do not establish financial, investment, or other advice. Investing in or trading crypto assets comes with a risk of financial loss.




