
 Quantus
 Pearl
Pearl Quack AI
 Starknet
 NEAR Protocol
 Zcash
Zcash Aerodrome Finance
- United Parcel Service, Inc.’s profit margin percentage is declining.
- United Parcel Service, Inc, has an EBITDA of $2.2 Billion and it has declined by -40.1% YoY.
- UPS stock has given a return of -18.7% in the previous year.
United Parcel Service, Inc. (NYSE: UPS) operates as a company specializing in package delivery services and offers comprehensive solutions for global supply chain management.
In the weekly timeframe, the price of UPS stock is on a downtrend, characterized by a consistent pattern of forming lower highs.
The company’s Earnings before interest, taxes, depreciation, and amortization (EBITDA) stands at $2.2 billion, reflecting a yearly decline of -40%. UPS stock has a total trading volume of 4.8 million and a circulating supply of 723 million shares.
Over the past six months, the UPS stock price has witnessed a significant decline of -18.7%, indicating a poor performance by the company.
A comprehensive analysis of technical indicators highlights a prevalent negative momentum for UPS stock. Among the 26 indicators analyzed, 13 are signaling a ‘sell’, implying a potential price decline in the near future.
Furthermore, the company’s profit margin percentage has decreased. In Q4 2022, the profit margin was 12.5%, which declined to 5% in Q3 2023, indicating a deteriorating performance and reduced returns.
The overall price structure of the stock is weak, and the price has recently reached a swing low. This suggests an increased likelihood of a price decline.
United Parcel Service, Inc. (UPS) Stock Price Analysis
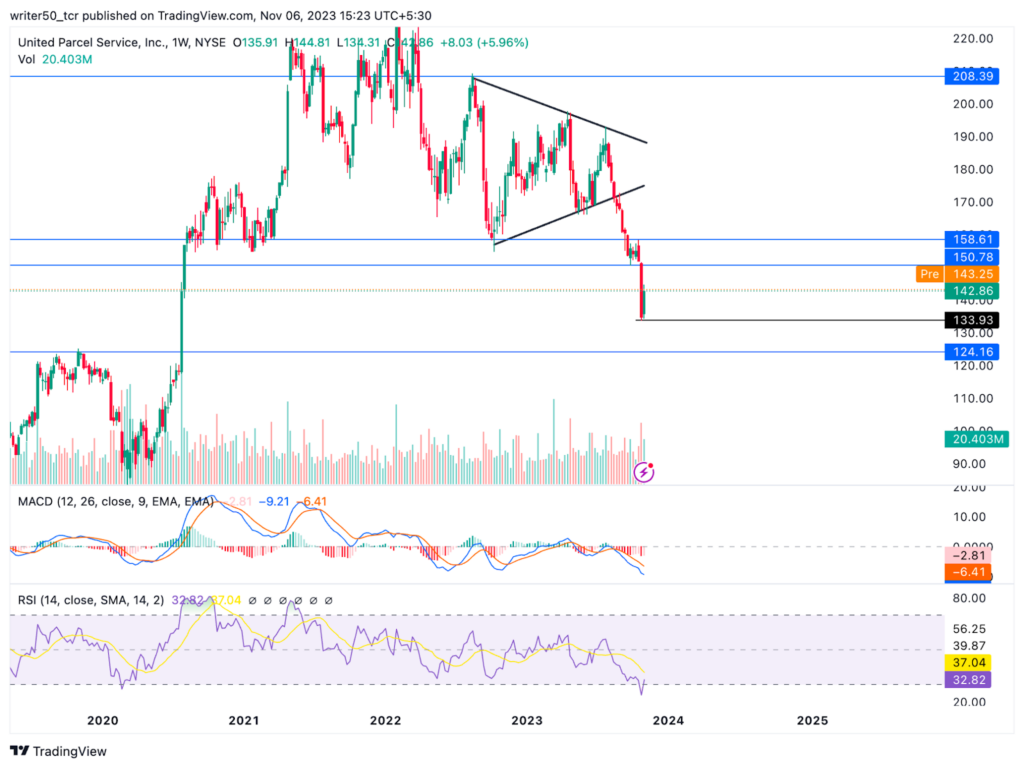
Coming to the technical indicators, we can observe that the signal line is positioned below both a red histogram formation and the MACD line. This configuration indicates weakness in the stock and raises the likelihood of a future price drop.
Additionally, both the 14-day SMA line and the RSI line for UPS stock are hovering near the 30 mark. The negative placement of the RSI line indicates that the price might fall lower in the future.
Conclusion
In conclusion, UPS stock is indicating a downward movement. The price has given a negative return in the previous year along with the formation of a lower low pattern. The indicators are negative for the stock and the overall structure is also negative. Hence, the price is expected to decline in the upcoming days.
Technical Levels
- Support Level– $133 and $124
- Resistance Level– $150 and $18
Disclaimer
The views and opinions of the author, or anyone named in this article, are for informational purposes only. They do not offer financial, investment, or other advice. Investing or trading crypto assets involves the risk of financial loss.




