
 Minter
 Sui
Sui Pons
Pons NEAR Protocol
 Starknet
 Quack AI
 Chainlink
- The TBLA stock price is moving toward the $4.45 resistance level.
- Technical analysts are suggesting a ‘strong buy’ signal at the current trading phase.
Taboola (NASDAQ: TBLA) is a public advertisement company that powers recommendations across the open web. It partners with websites, mobile apps, and devices and provides advertisements such as ‘Around the Web’ and ‘Recommended for you’ boxes at the bottom of many online news articles.
TBLA Stock Forecast and Price Movements
The company has been performing in a balanced manner for the last few years. It performed according to its annual estimations. In 2022, it generated total revenue of $1.40 Billion, close to the estimates with a surprise of 0.27%.
However, the TBLA stock price experienced a fall of 60% in the same year. Meanwhile, the 2022 estimate for earnings was -$0.05 which remained similar to the reported EPS. This shows that the firm met the investors’ expectations.
According to the quarterly data, TBLA stock has been outperforming its quarterly estimations since the second quarter of 2022. In the third quarter of 2023, it reported its revenue to be $360.22 Million whereas the estimation was $345.06 Million.
In the current quarter, the firm has estimated its revenue to be $448.21 Million. It is currently the highest estimated revenue among all of the 2023 quarterly estimates. This could be a positive indication for the investors.
Technical Analysis of TBLA Stock
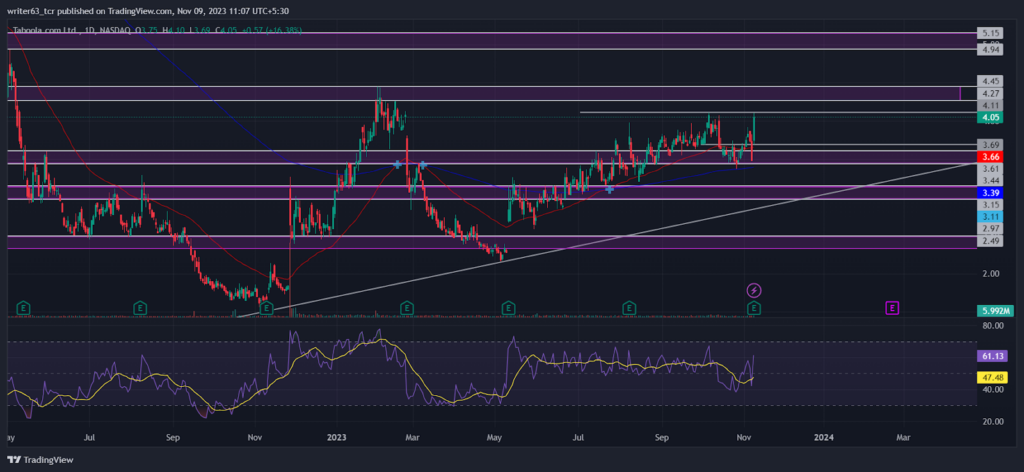
The TBLA stock price is moving in an uptrend. The 50-day EMA and the 200-day EMA have become bullish after both made a bullish crossover in July 2023. At present, the price took important support at the 200-day EMA while the 50-day EMA became responsible for the short bull run from the $3.66 level.
At press time, the TBLA stock price is at $4.05 by taking support at the $3.44 level. In the last trading session, it formed a strong bullish candle at $3.69, reflecting the buying pressure at that level. The price is moving toward the $4.11 immediate resistance level. If it breaks above that level it may rise toward the $4.45 resistance level.
Furthermore, the relative strength index (RSI) is showing sideways momentum with an internal bearish divergence, which could be a false indication. Currently, the RSI is moving at 61.13 toward the 70-mark upper band.
Conclusion
The TBLA stock price is moving in a short range of higher highs and higher lows. On the other side, the major trendline is forming below the current share price, which may become a major support in the future. At press time, it is moving toward the $4.11 immediate resistance level. If it breaks above that level it may rise toward the $4.45 resistance level. However, if it closes below the $3.44 support level then the $3.15 support level at the trendline will become a pivotal point for an uptrend.
Technical Levels
- Resistance levels: $4.11 and $4.45
- Support levels: $3.44 and $2.97
Disclaimer
The views and opinions stated by the author, or any person named in this article, are for informational purposes only. They do not establish financial, investment, or any other advice. Investing in or trading stocks comes with the risk of financial loss.




