
 Minter
 Quack AI
 NEAR Protocol
 Pearl
Pearl Monero
 Pons
Pons Sui
Sui
- Bank of America stock price is currently above 20, 50, and 100-day EMA levels.
- BAC stock is currently trading at $0.81.
- BAC live market cap is $254.35 Billion.
Bank of America stock price is currently moving in an uptrend direction. The price of BAC is currency forming a higher high with a good volume.
The BAC stock has a market capital of $254.35 Billion and the EPS of the stock is 3.50. The stock has 52 weeks high of $38.60 and 52 weeks low of $26.32. Also, the P/E ratio of BAC is 9.04, which denotes the stock’s earnings are neutral neither less nor high.
Bank of America (BAC) shares witnessed a sharp drop of almost -45% over the subsequent one and a half years after reaching its high of $50.11 in February 2022. However, the $27 level provided support for the stock, which then went through a period of consolidation.
After the period of consolidation, the stock showed a breakout from a range with significant momentum. The stock price of BAC has increased by 16% in one month and in the last four trading days it gave a rise of 7%,
After the breakout from a significant level of resistance, the price prediction of BAC stock appears to be forming a bullish momentum. The overall structure of the stock is strong and the price is likely to form new swing highs.
Bank of America (BAC) Stock Price Analysis
EMA
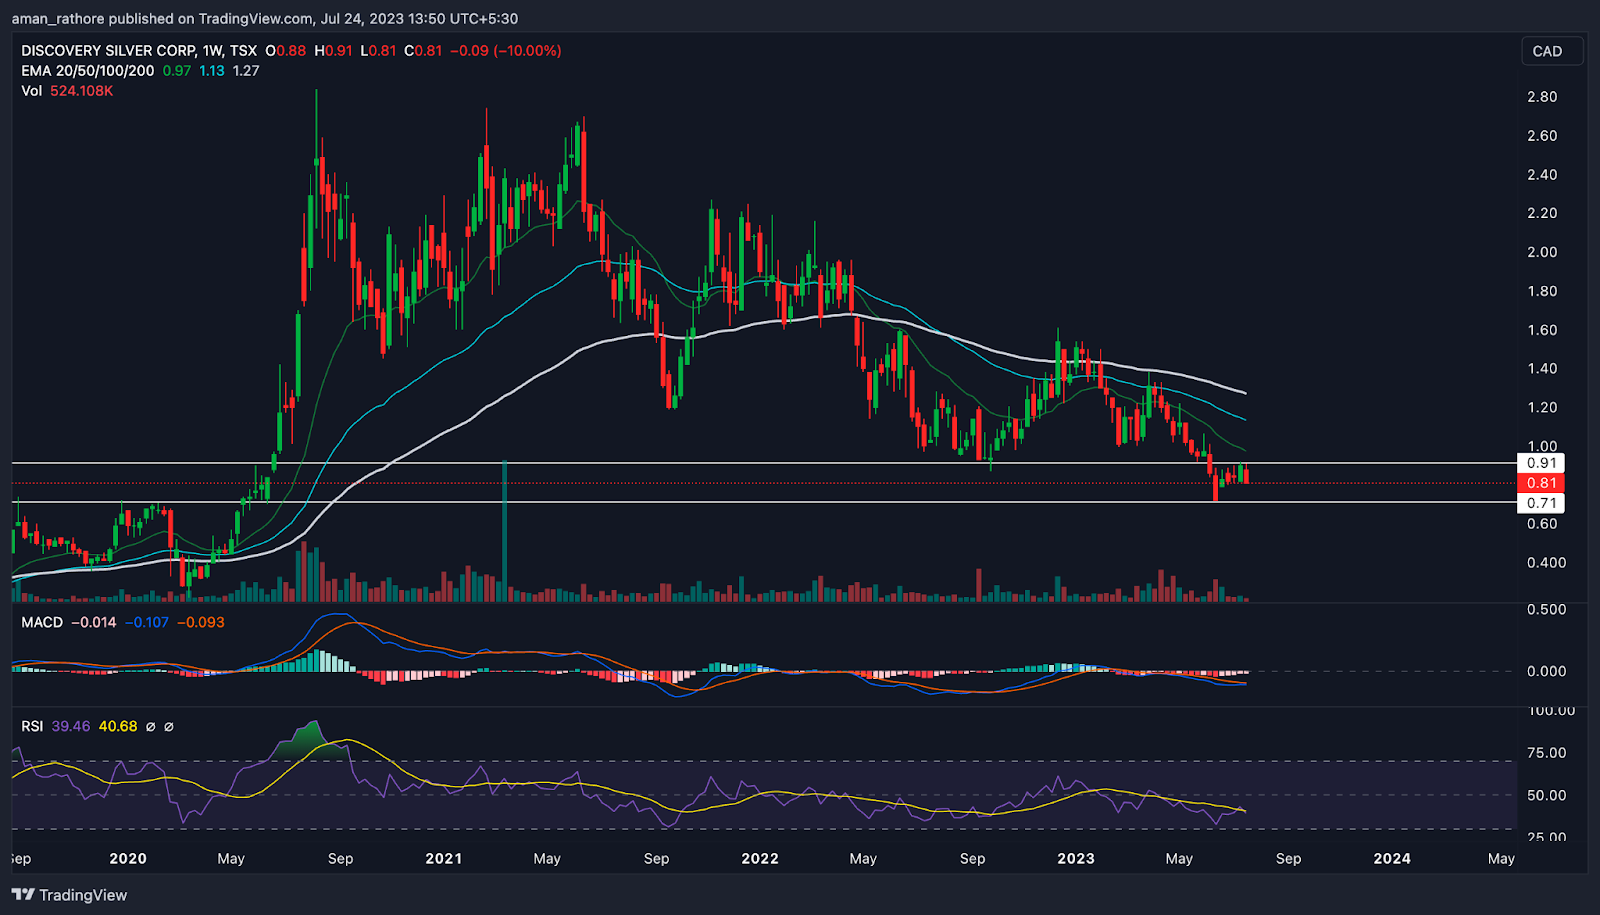
The stock price of Bank of America (BAC) stock is currently trading above the 20-day, 50-day, and 100-day EMA levels. This is a positive signal for the stock and prices might rise in the upcoming days.
MACD
The Bank of America (BAC) stock’s MACD line is trading above the signal line on a daily time frame chart, adding to the positive move. This indicates that the stock price is likely to rise in the upcoming days.
RSI
The RSI line for BAC stock is currently at 74 level and the SMA line is at 61 level. This indicates that the stock is currently in an uptrend direction and prices might rise in the future.
Conclusion
tThe Bank of America (BAC) stock as per the analysis is exhibiting a positive uptrend momentum. The stock is forming a higher high pattern and the price is likely to rise in the upcoming days. The indicators like MACD, RSI, and EMA are also signifying the possible up move in the future.
Technical Levels
- Support Level– $33.33.
- Resistance Level– $30.
Disclaimer
The views and opinions of the author, or anyone named in this article, are for informational purposes only. They do not offer financial, investment, or other advice. Investing or trading crypto assets involves the risk of financial loss.




