
 Boomer
 Covenant x402
 Claudia
 Pearl
Pearl Quantus
 Bitcoin
 NEAR Protocol
- CEY stock price is currently trading at $91.70.
- The Stock price is currently trading inside a falling channel pattern.
Centamin Plc. is a mining company that was found on March 24, 1970. The company works for the exploration, development, and mining of precious metals. It operates through Eygpt, Burkina Faso, Cote d’Ivoire and corporates.
CENTAMIN Plc Stock (CEY): Financial Analysis
Centamin Financial report has shown stable growth in the last 3 years with some ups and downs in the revenue report from 2020 to 2022 with an overall growth of 0.07%. In 2021, the revenue report was down by 0.10% but the company manages to recover the previous year’s decline with 0.20% growth in 2022.
CEY Revenue report for 2023 is estimate to have a growth of 0.06%. The company revenue growth has shown stable growth in the last three years which shows that the company is capable of meeting the estimated revenue in 2023.
The Centamin company had consistently paid an average of 50 plus payout ratio dividends over the last three years.
CENTAMIN Plc Stock (CEY): Technical Analysis
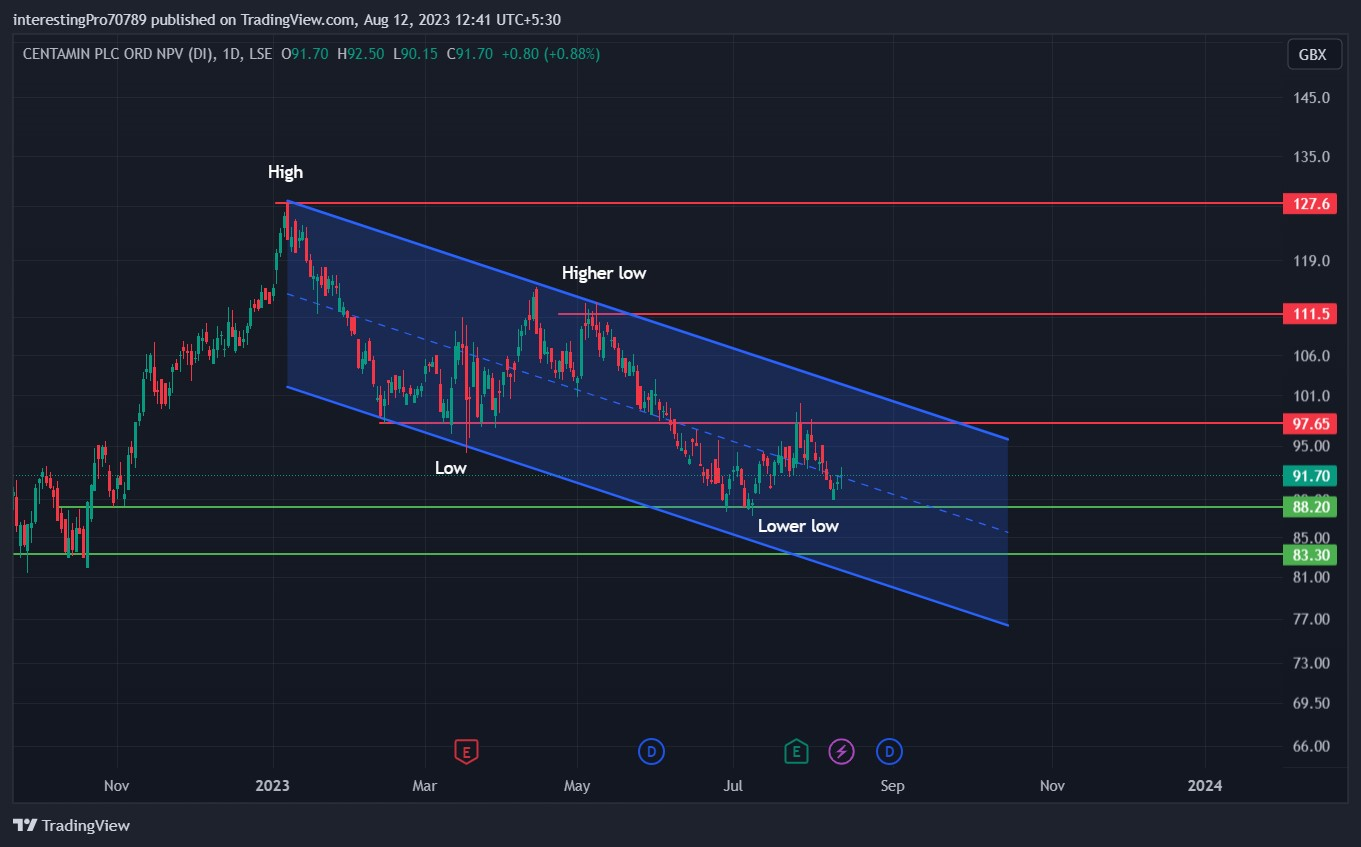
Currently, the CEY stock price is trading at $91.70 with an average volume of 2.14M and with a market capitalization of 1.051B.
In January 2023, the CEY price faced rejection from the $127.6 resistance level and the price started falling. The price fell to $97.65 from there and the price formed a support and sustained over it for about 4 months.
In June 2023 the price closed below the $97.65 support by giving a breakdown of that support level and the price again started to fall to the $88.20 support level. Current, the price is sustain over $88.20 support and is stuck in a range starting from $88.20 to $97.56. So if price consolidate in this range and form a strong base and give the breakout of the falling channel pattern and the resistance level of $97.65 then the price can be seen in a bullish sentiment till $111.5 and then to 127.6. And the price gives the breakdown of $88.20 support the price is more likely to continue its downtrend till its next support at $83.30.
Technical Indicators Prediction about the current trend.
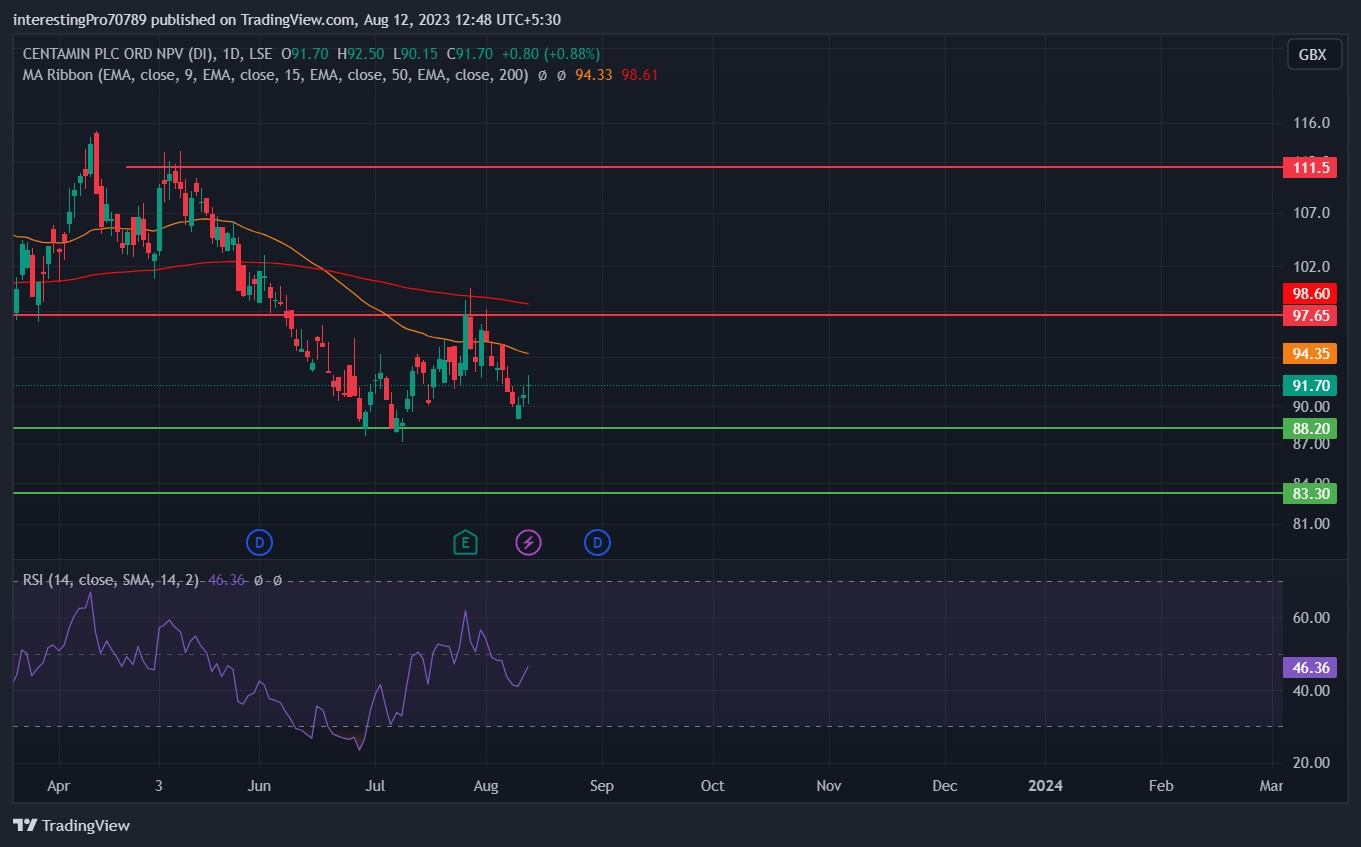
The 50 EMA (yellow line) is at $94.35 and the 200 EMA (red line) is at $98.60. The price is currently trading below the 50 and 200 EMA which indicates that price is bearish sentiment and the sellers are showing their dominance in current scenario.
The relative strength index (RSI) is at 46.36 which shows the price is currently in neutral territory taking pressure from the buyers and the seller as well.
Conclusion
The overall chart of CENTAMIN (CEY) is bearish as the price is still in a falling channel pattern. If the price breaks, the $88.20 support then the downtrend is more likely to be continue. The only way to see price in bullish sentiment is when price gives a breakout this channel and the $97.65 resistance level. Indicators mentioned above are bearish, and RSI is neutral territory which indicates price is taking pressure from buyers and sellers.
Technical levels
Resistance levels: $97.65, $111.5 and $127.6.
Support levels: $88.20 and $83.30.
Disclaimer
The views and opinions stated by the author, or any people named in this article, are for informational purposes only. They do not establish financial, investment, or other advice. Investing in or trading crypto assets comes with a risk of financial loss.




