
 Minter
 Bittensor
 Quack AI
 NEAR Protocol
 Pons
Pons Pearl
Pearl Bitcoin
- The THG Stock price is currently trading at $103.55
- The stock chart shows bullish sentiment from the past 55 days
THG recently got into advanced talk and bought the loss-making newspaper company City AM. The company is expect to pay a seven-figure sum to the newspaper company, Including its brands and website.
THG CEO Matthew Moulding said that his motive to buy City AM was to cut the middleman when bringing content to the consumer. He also added that editorial content will be created by the newspaper. This acquisition can help the company grow in the future.
THG Plc Stock: Financial Analysis
THG’s financial report has shown stable growth within the last two years in the revenue report from 2020 to 2022, with an overall growth of 0.39%.
The previous two-year revenue growth did not have a significant impact on the stock price of THG.
THG’s Revenue report for 2023 is estimated to have a growth rate of 2.21 billion. The company’s revenue growth has shown stable growth in the last two years, which shows that the company is capable of meeting the estimated revenue in 2023.
THG Plc Stock: Technical Analysis
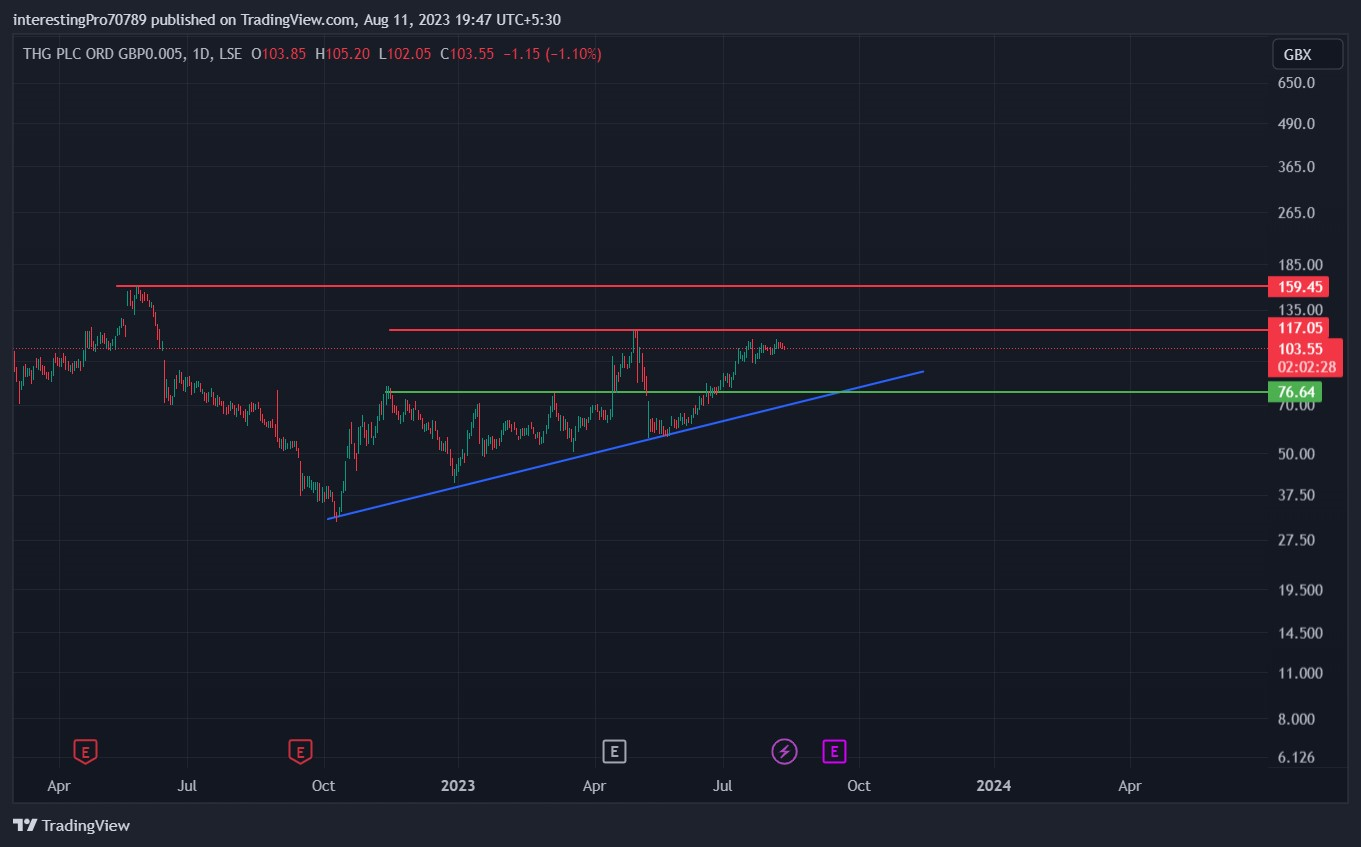
Currently, the THG stock price is trading at $103.05 with an average volume of 2.519 million and a market capitalization of 1.361 billion.
In October 2022, THG stock price showed a bullish rally after taking support from $31.43. The price faced rejection from $76.64 and fell to $42.72 and formed support for the trendline. The price was in the range of these two for at least 7 months.
In April 2023, the price broke the resistance of $76.64 and rallie to $117.05, and the form price was seen falling after a very heavy reject from there, and it went back inside to its $76.64 resistance.
In May, the price started a parabolic bullish move without a single pullback or retracement, breaking the $76.64 resistance again and reaching the $117.05 resistance. Currently, the price is trading below the $117.05 resistance level, and there is a chance of the price getting reject from that level as the price has moved this much in the last 55 days. Again, the price can be at the $76.64 level, which has a support zone now. But if it manages to break the 117.05 resistance, then the price can be seen at its next resistance, which is at $159.45.
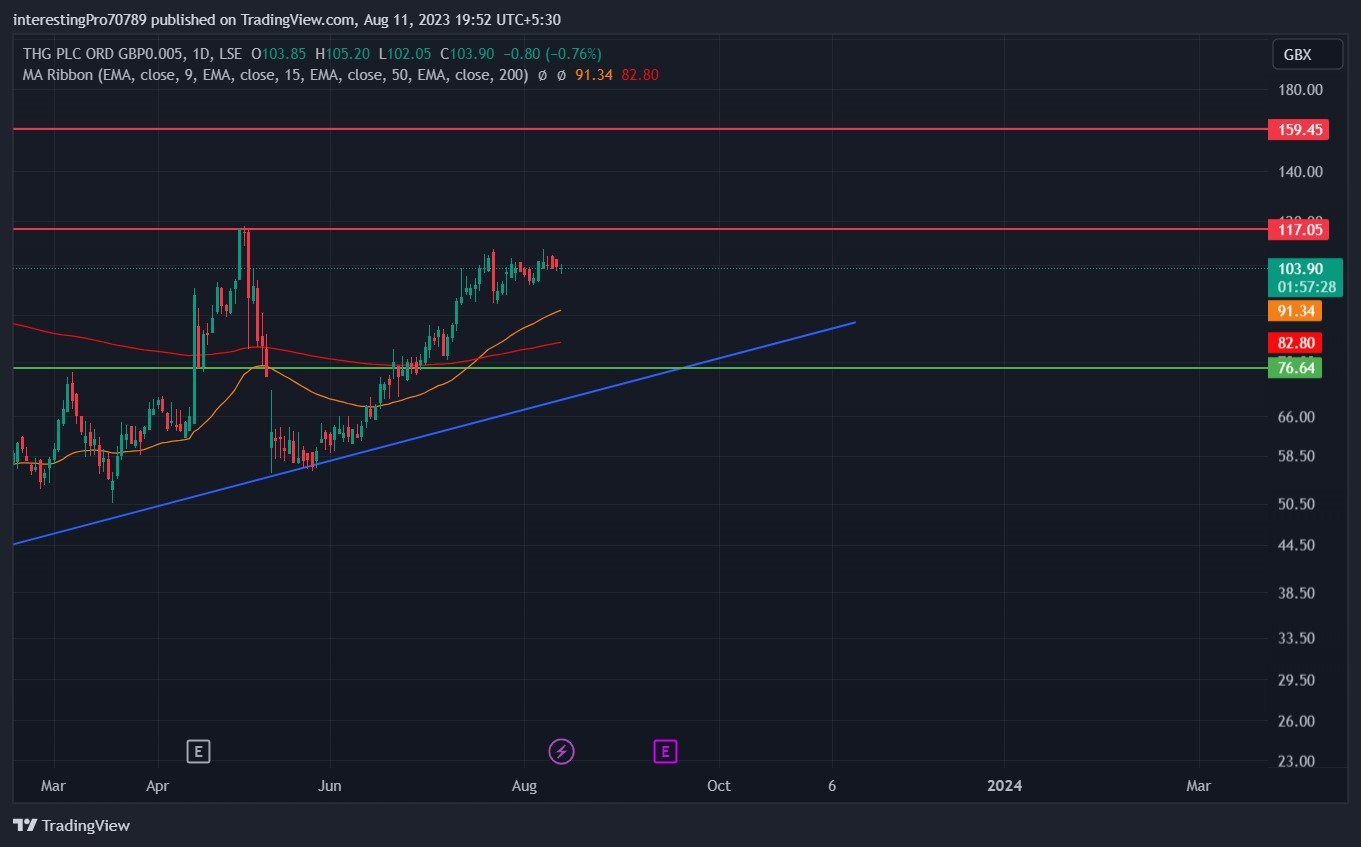
The 50 EMA (yellow line) is at $91.34 and the 200 EMA (red line) is at 82.82. Recently, the EMA line has shown a crossover where the 50 EMA has intersected the 200 EMA from the downward to the upward side, and the price is also trading above both EMA’s. This indicates that the price is still in the bullish zone.
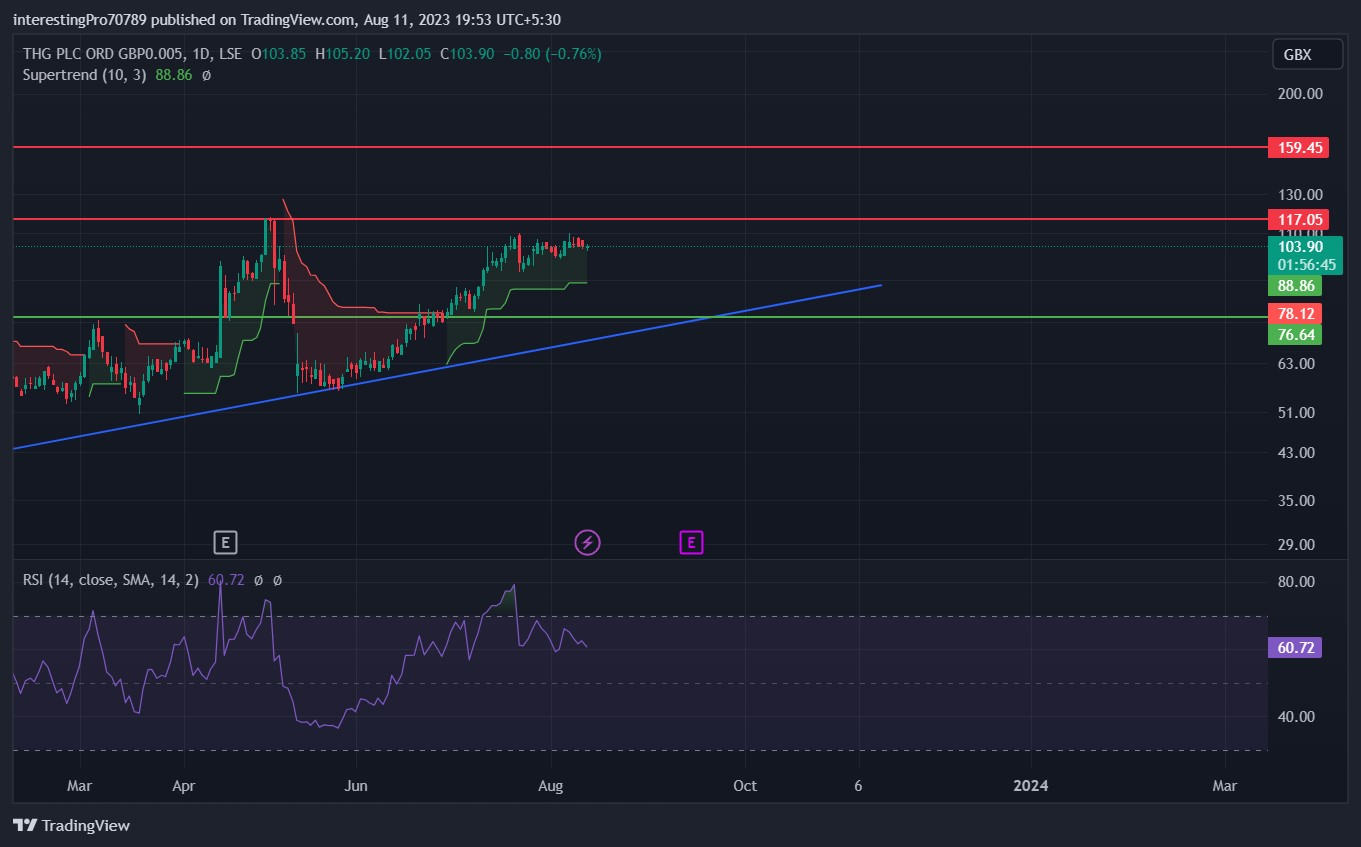
The Relative Strength Index (RSI) is at 60.72, which indicates that the price is in bullish territory.
The Super-Trend indicates that the price is bullish sentiment as the price is still trading above the green line. A Bearish move is only expect if the price closes below the green line.
Conclusion
The overall chart of the THG is bullish right now, but a pullback or retracement can be seen in the short term as the price has moved without any retracement and is also trading near its resistance level of $117.05. If price break through the resistance, then the rise in price can be seen until its next resistance at $159.45. All the indicators mentioned above are bullish as of right now.
Technical levels
Resistance levels: $117.05 and $159.45.
Support levels: $76.64.
Disclaimer
The views and opinions stated by the author, or any other person named in this article, are for informational purposes only. They do not provide financial, investment, or other advice. Investing in or trading crypto assets comes with a risk of financial loss.




