
 Quack AI
 Lighter
 Pudgy Penguins
 Bittensor
 Solana
 Aptos
Aptos Quantus
- EQT stock price is currently trading at $42.79
- The stock price has bullish momentum
EQT Corporation Stock: Financial Analysis
EQT’s financial report has shown stable growth within the last year, with ups and downs in the revenue report from Q2 2022 to Q1 2023, with an overall growth of 0.17%. But in the recent Q2 2023 report, the company had a decline of -0.46% in revenue growth from the previous report.
The previous two earnings and revenue reports of EQT showed great growth, resulting in a rise in the price of EQT stock of more than 35%.
The EQT Q3 2023 report’s estimated growth in revenue is expected to be 0.12% higher than the previous Q2 2023 report. The EQT revenue growth has shown a decent growth in revenue within the last year, which shows the company can meet the estimated revenue in the Q3 2023 report.
EQT Corporation Stock: Technical Analysis
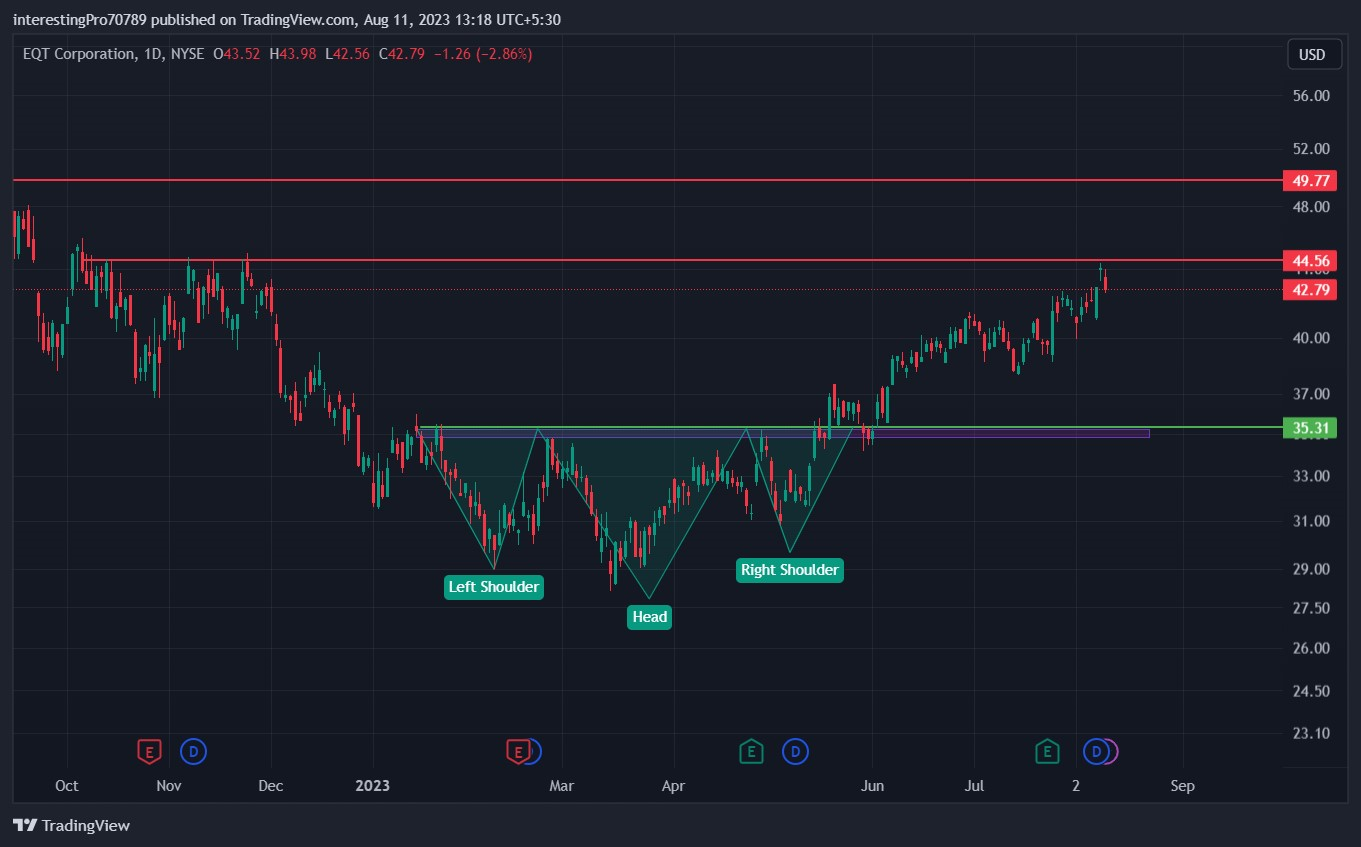
Currently, the EQT stock price is trading at $42.79 with an average volume of 6.072 million and a market capitalization of 15.475 billion.
In November 2022, EQT’s stock price faced rejection, and the stock price almost fell more than 35%, making a higher low structure. After that, the price was stuck in a wide zone from $28.42 to $35.31, and then in March 2023, the price started to move in the upward direction, making higher highs and forming an inverted head and shoulder pattern.
If the price of EQT stock closes above the $44.56 resistance level and sustains and forms a base over the $56 resistance level, then the price will continue its bullish momentum till the $49.77 resistance level. If the price fails to close above the $44.56 resistance level, then the price can be seen at $35.31 support and could consolidate between these two levels.
Technical Indicators prediction about the current trend
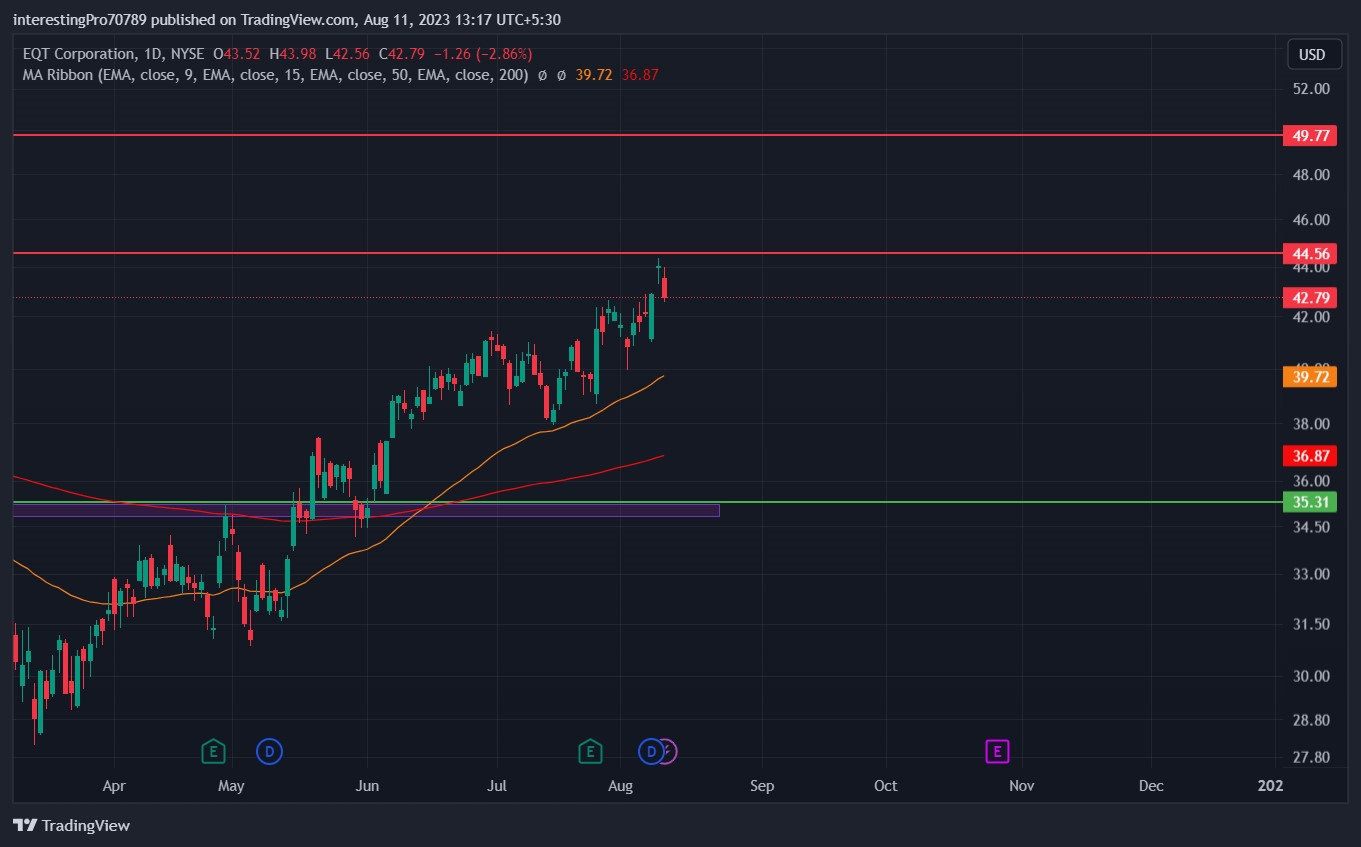
The 50 EMA (yellow line) is at $39.75, and the 200 EMA (red line) is at $36.87. Recently both EMAs have shown a crossover where the 50 EMA crossed the 200 EMA from the downward to upward side, which is also seen as golden crossover, which indicates the price can show bullish momentum, and after the crossover, the price showed a bullish rally. currently the price is trading above the 50 and 200 EMAs, which indicates the bullish sentiment is still in the EQT stock price.
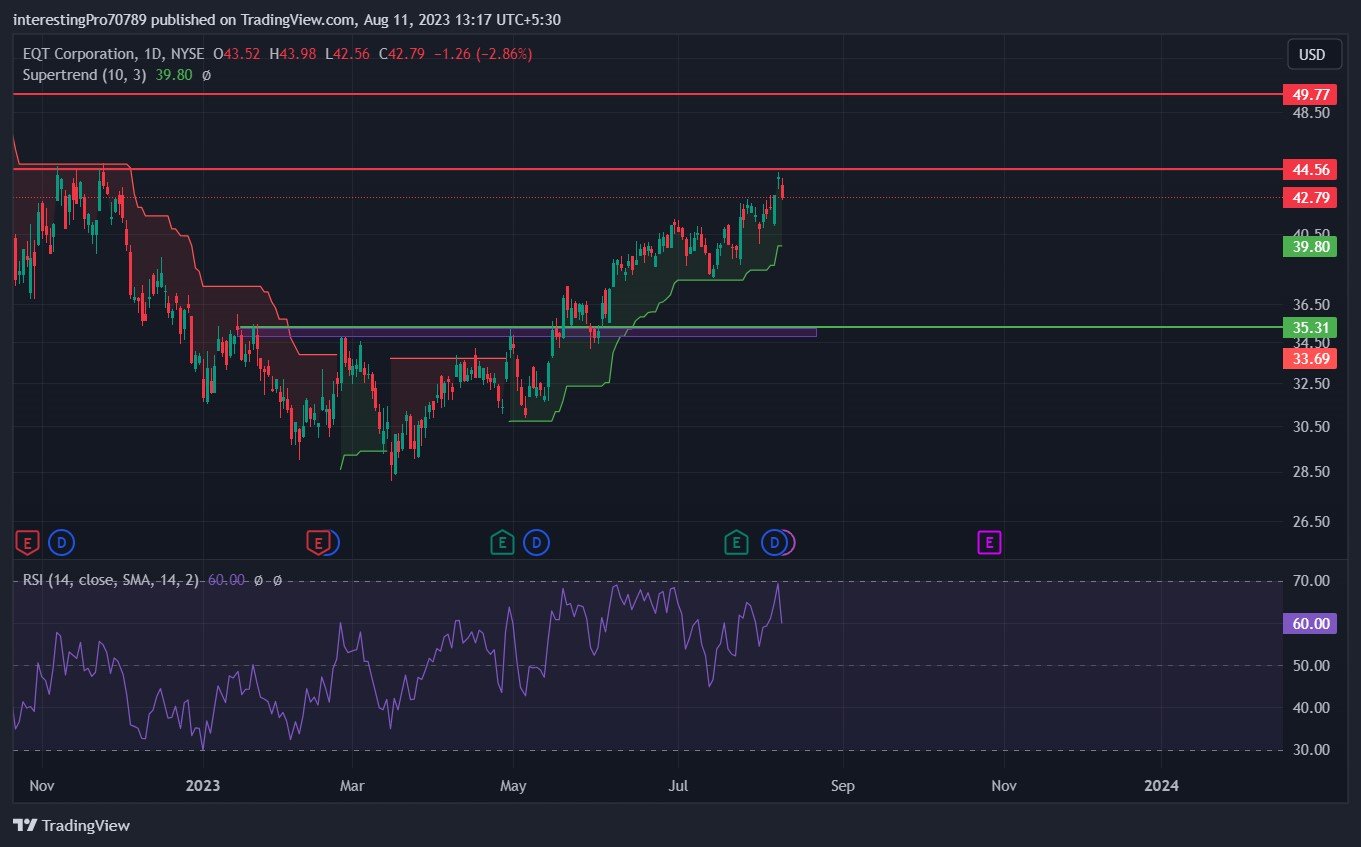
The Relative Strength Index is at 60.00, which indicates the price is in bullish territory and buyers are still in power and can commence a bullish rally.
Super Trend is indicating that the price is still bullish sentiment as the price is still trading above green line. A bearish move is only expecte when the price closes below the green line.
Conclusion
The overall chart of EQT stock is bullish. The stock is currently trading below the $44.56 resistance. If the EQT price manages to breakout, it can continue its rally. But if price fails to close above the resistance of $44.56, then the price can shows bearish move until it reaches $35.31 support in a short term period. All the indicators mentioned above are bullish as of right now.
Technical levels
Resistance levels: $44.56 and $49.77
Support levels: $35.31
Disclaimer
The views and opinions stated by the author, or other person named in this article, are for informational purposes only. They do not provide financial, investment, or other advice. Investing in or trading crypto assets comes with a risk of financial loss.




