
 Quantus
 Injective
 Bitcoin
 Quant
Quant Pudgy Penguins
 Raydium
 Bittensor
- MKS stock price is currently trading at 230 GBX.
- The company stock chart reflects a bullish sentiment.
Mark and Spencer (LON:MKS) was founded on 28 September 1884 by Michael Marks and Thomas Spencer. The company deals with the retail of clothes, food, and home products.
On 16 August 2023, the Numis company upgraded its rating for Marks and Spencer to from “hold” to “add” and also raised the price target for MKS shares to 250 pounds from 195 pounds. This caused a substantial 4% increase in the share price of M&S during the midday trading session.
Mark & Spencer (MKS) Stock: Financial Analysis
The company’s financial report has shown growth in the last 3 years in the revenue report from 2020 to 2022, with an overall growth of 0.30%. There was a growth of 0.10% in each year from 2020 to 2022.
The estimated revenue for the company in 2023 is $12.65 Billion. Going by the previous revenue reports, the company has the potential to achieve this estimated revenue target.
Marks & Spencer (MKS) Stock: Technical Analysis
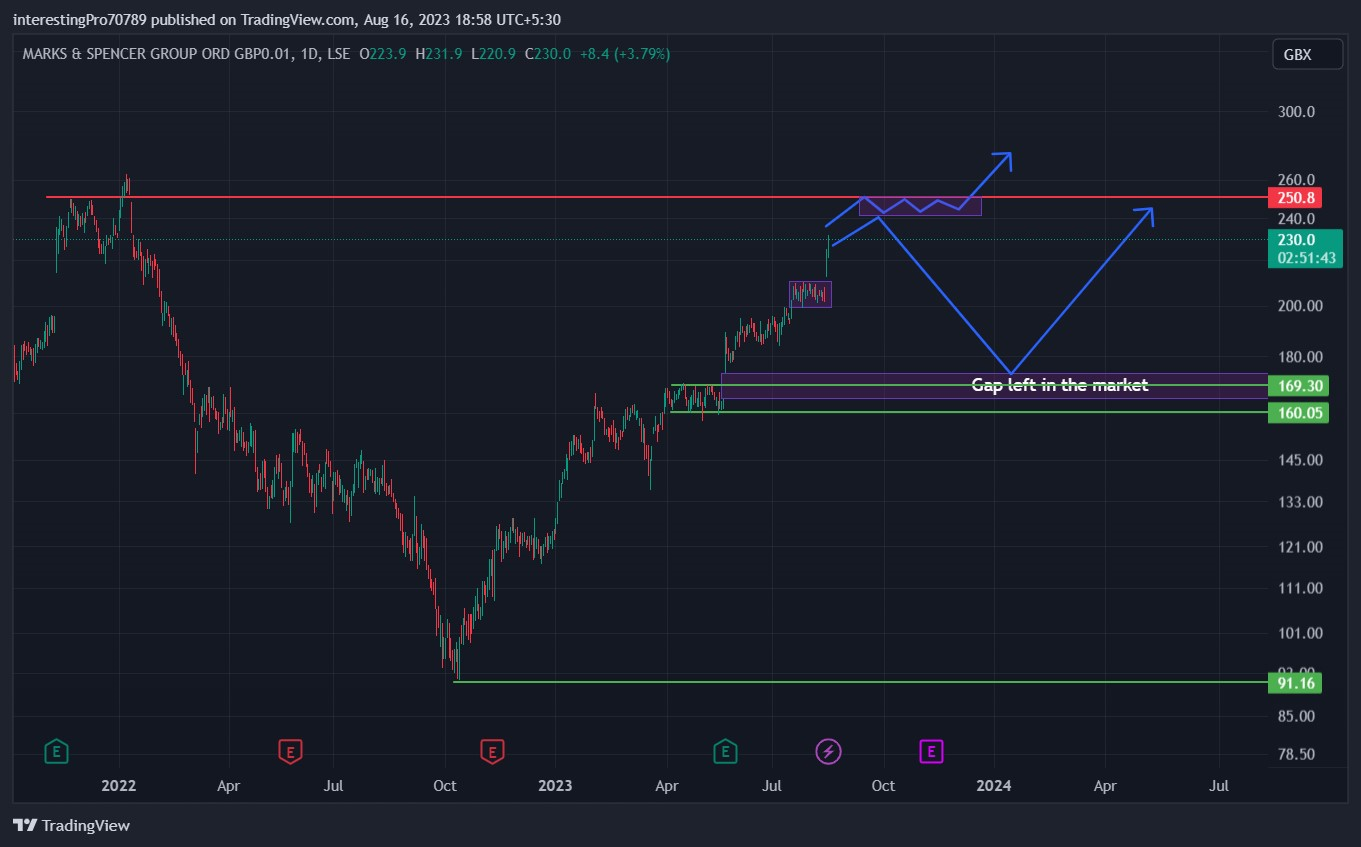
In December 2021, MKS stock price closed above the 250 GBX resistance level but the price was not able to sustain above this level. The price faced a heavy rejection and the price declined by 65%. The breakout was turned into a fakeout which trapped buyers.
In October 2022, the price formed support at 91.16 GBX and initiated a bullish rally. The stock price has managed to chart a v-shape recovery in the market.
In April 2023, the price got stuck in a narrow range between 160 GBX to 169.30 GBX. In May 2023, the price broke the resistance of the narrow zone with a gap-up opening and started its bullish rally. The price was once again stuck in a narrow zone after a bullish rally in July 2023.
The recent price action has demonstrated a notable breakout from the confines of a narrow zone, fueling a continued bullish trajectory. The current price is in close proximity to the 250 GBX resistance level. Over the past months, a pattern emerged wherein the price underwent consolidation within a confined range, subsequently leading to a bullish rally. Should the price replicate this pattern by consolidating beneath the 250 GBX mark and then securing a breakout above it, a renewed bullish rally may ensue.
However, in the event that the price encounters resistance at the 250 GBX level, a scenario could unfold wherein the price retraces to fill a gap that had been previously left in the market. This concept aligns with price action principles, which often witness prices retracing to fill gaps, serving as a minor pullback in a market primarily dominated by buyers. Following this gap-filling pullback, the price could potentially launch into another bullish rally starting from the 160.00 GBX level.
Technical Indicators’ Prediction About the Current Trend
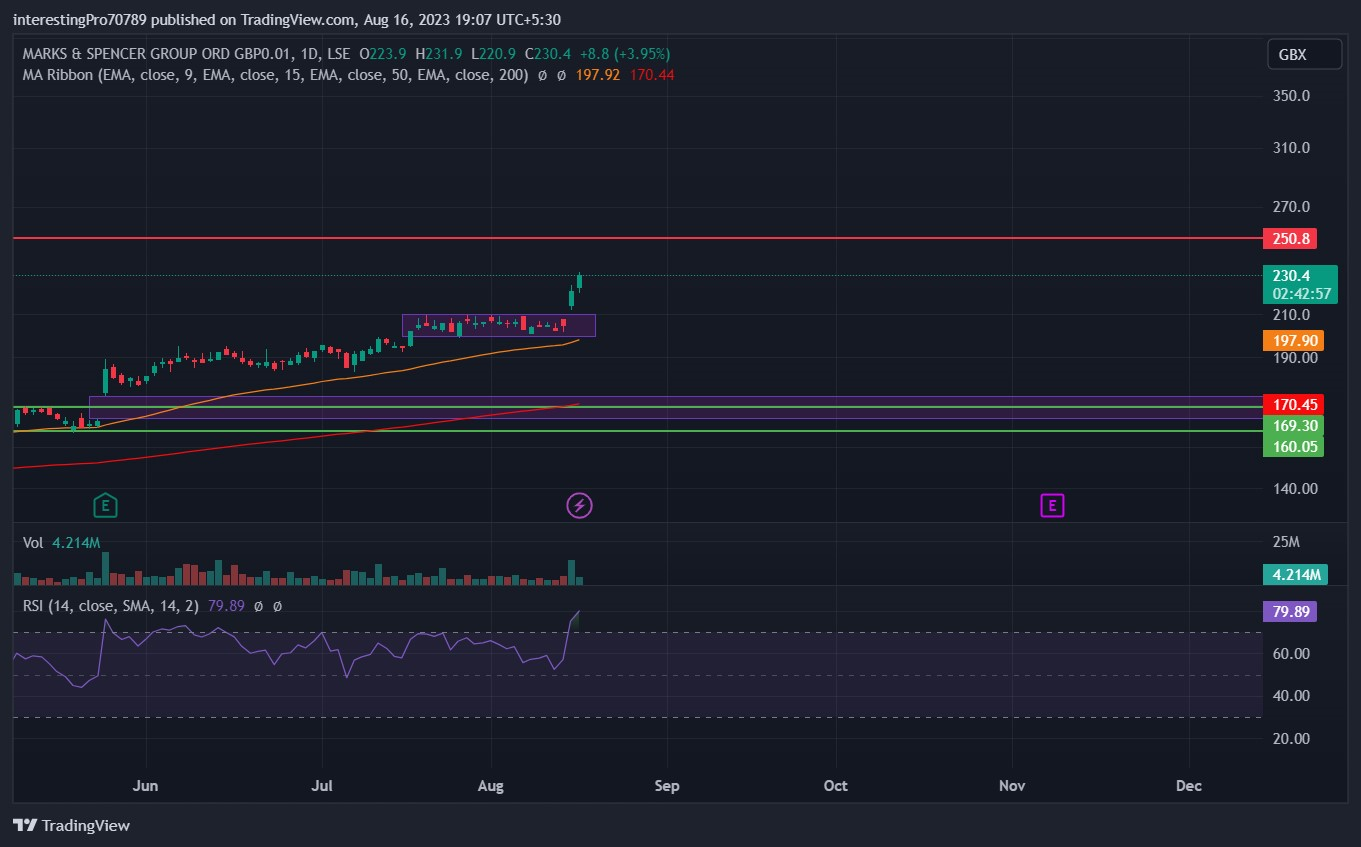
The 50 EMA (yellow line) is at 197.90 GBX and the 200 EMA (red line) is at 170.45 GBX. Currently, MKS price is trading above the 50 and 200 EMA lines which indicates the bullish sentiment in the price and also the control of buyers.
The relative strength index (RSI) is at 79.91, which indicates that the RSI and price are in the overbought territory and a pullback or retracement can be expected in the market.
Conclusion
The overall chart of Marks & Spencer stock is bullish and is reflecting an absolute dominance of buyers in the market. All the indicators are bullish at the time of writing. However, the RSI is in the overbought territory which indicates the possibility of a pullback or retracement occurring within the MKS price chart.
Technical levels
Resistance levels: 250 GBX.
Support levels: 160 GBX.
Disclaimer
The views and opinions stated by the author, or any people named in this article, are for informational purposes only. They do not establish financial, investment, or other advice. Investing in or trading crypto assets comes with a risk of financial loss.




