
 Minter
 Quack AI
 NEAR Protocol
 Pearl
Pearl Sui
Sui Pons
Pons Quantus
- PETS stock is currently trading at £365.8.
- The chart of the company is currently displaying a consolidation phase.
Pets At Home Group was founded in 1991 by Anthony Preston. The company operates as a holding company that deals in the retail of pets, pet food, and pets-related products.
Pets At Home reported a significant rise of 10% in consumer revenue over the course of 16 weeks on August 3, 2023. This positive growth indicates the company’s overall health and success in its business operations. Additionally, the company announced an underlying pretax profit figure that excludes exceptional items.
Pets at Home (PETS) Stock: Financial Analysis
The revenue report of Pets At Home has displayed steady growth over the past three years, spanning from 2020 to 2022, resulting in an overall growth rate of 0.22%.
For the upcoming year of 2023, the company’s revenue is projected to experience a growth of 1.49 billion units. Considering the company’s performance in the previous three years, it has consistently managed to achieve its estimated revenue values. This trend suggests that the company possesses the capability to meet its projected revenue target for 2023.
Furthermore, Pets At Home has consistently maintained a dividend payout ratio of over 40% for the past three years.
Pets at Home (PETS) Stock: Technical Analysis
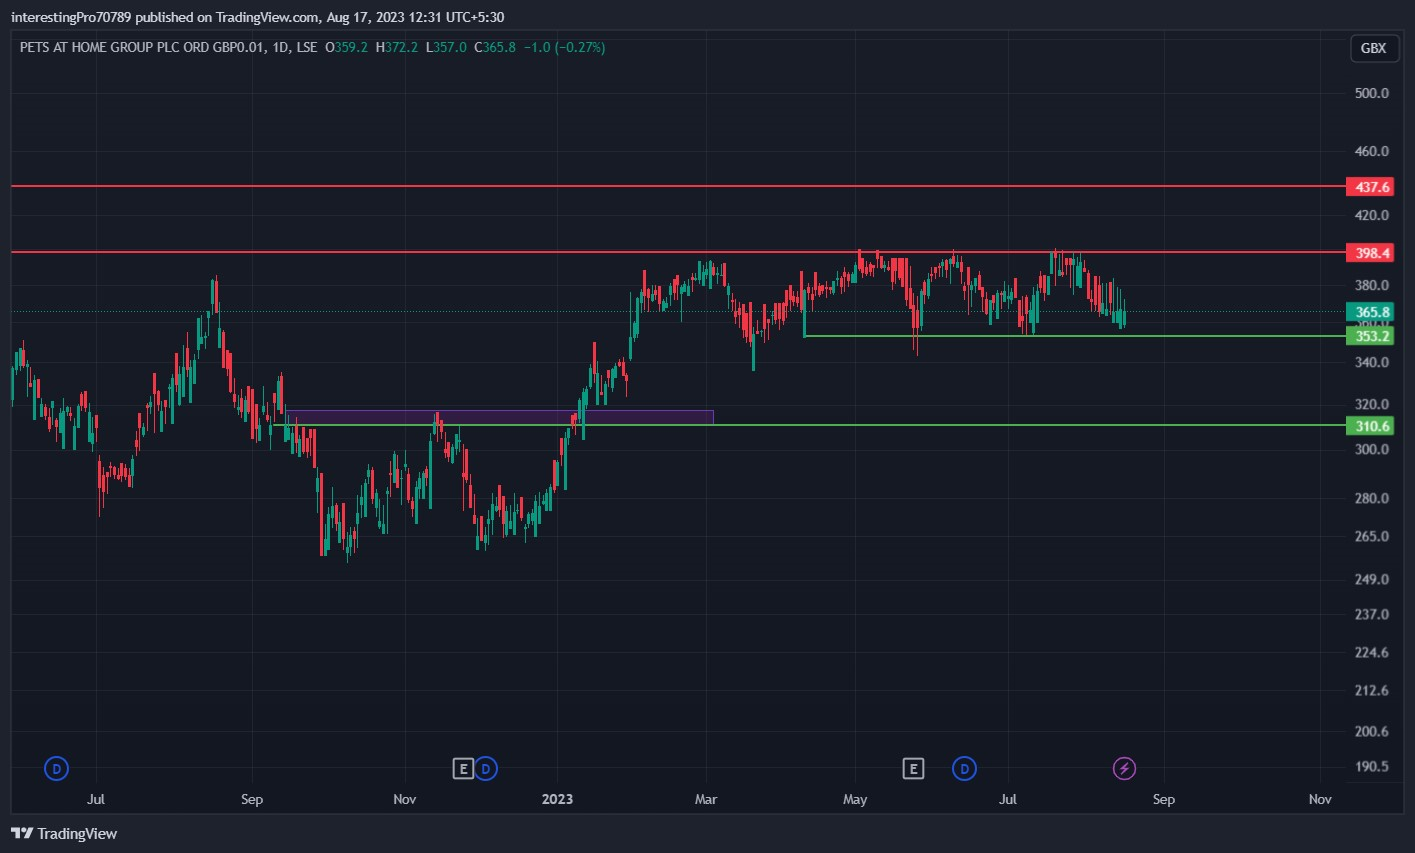
In September 2022, Pets At Home’s stock price began forming a bullish base, shaping a pattern known as a double-bottom. This pattern took approximately four months to develop on the company’s chart.
By January 2023, the stock price broke out of the neckline of the double-bottom pattern and surpassed the 310 GBP level, initiating a bullish rally. However, the rally encountered resistance at the 398.4 GBP level, resulting in a pullback to around 353.2 GBP. Buyers then pushed the price upwards once more, attempting to breach the 398.4 GBP resistance. Despite their efforts, the price encountered resistance again and returned to the 353 GBP support level.
Currently, the stock price is range-bound between 398.4 GBP resistance and 353.2 GBP support. This situation highlights the active involvement of both buyers at the support and sellers at the resistance levels, contributing to a scenario of price pressure from both sides. The stock price is again nearing the 353.2 GBP support.
If the price breaks below the 353.2 GBP support, a continuation of the bearish trend that originated from the 398.4 GBP resistance is likely. Conversely, if buyers successfully push the price beyond the 398.2 GBP resistance, the overall bullish trend may continue. Until one of these scenarios unfolds, the price could remain in a consolidation phase between these two ranges.
Technical Indicators’ Prediction About the Current Trend.
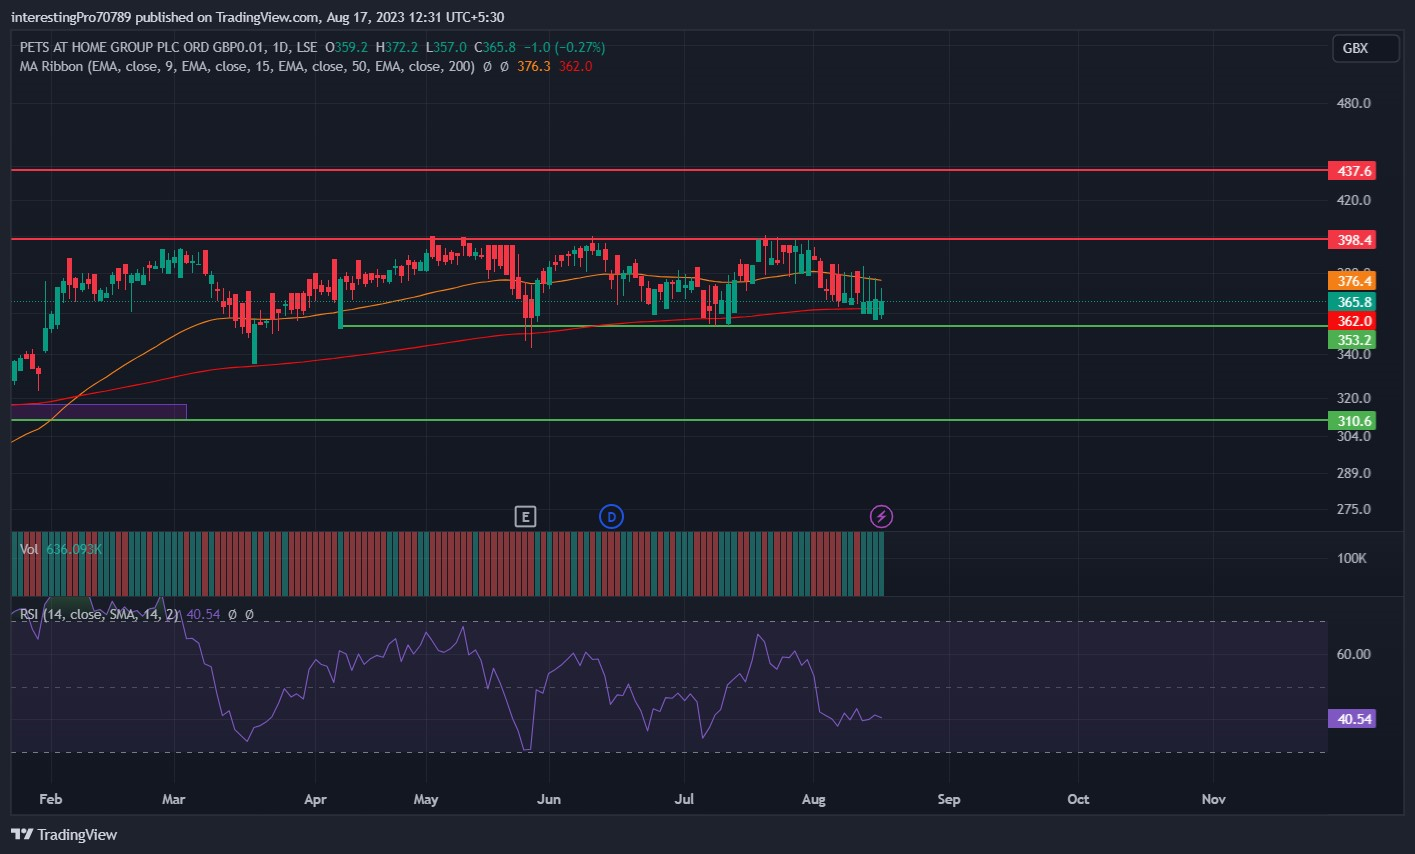
The 50 EMA (yellow line) is at 376.4 GBP and the 200 EMA (red line) is at 362 GBP. Both EMA lines are currently sideways as the price is stuck between two levels. This indicates that the price is indecisive right now.
The relative strength index (RSI) is at 40.54. This indicates that the is currently in neutral territory right now, facing pressure from both buyers and sellers.
Conclusion
The general trend of Pets At Home’s chart is bullish; however, the current situation finds the price trapped within a range of 398.4 GBP as a resistance and 353.2 GBP as a support level. The eventual breakout or breakdown of these two levels will determine the future trajectory of the Pets chart. It is advisable for traders to await the conclusive breach of either level before taking significant positions. At present, traders can consider initiating long positions near the support and short positions near the resistance, using confirmation candles as an indication of market sentiment.
Technical levels
Resistance levels: 398.4 GBP
Support levels: 353.2 GBP
Disclaimer
The views and opinions stated by the author, or any people named in this article, are for informational purposes only. They do not establish financial, investment, or other advice. Investing in or trading crypto assets comes with a risk of financial loss.




