
 Quack AI
 Pearl
Pearl Solana
 NEAR Protocol
 Canton
 XRP
XRP Derive
- Raytheon Technologies Corp.’s stock is trading below 50-day and 100-day EMA levels.
- RTX’s stock price is trading at $86.04.
- Raytheon Technologies Corp. (NYSE: RTX)’s live market cap is $125.23 Billion.
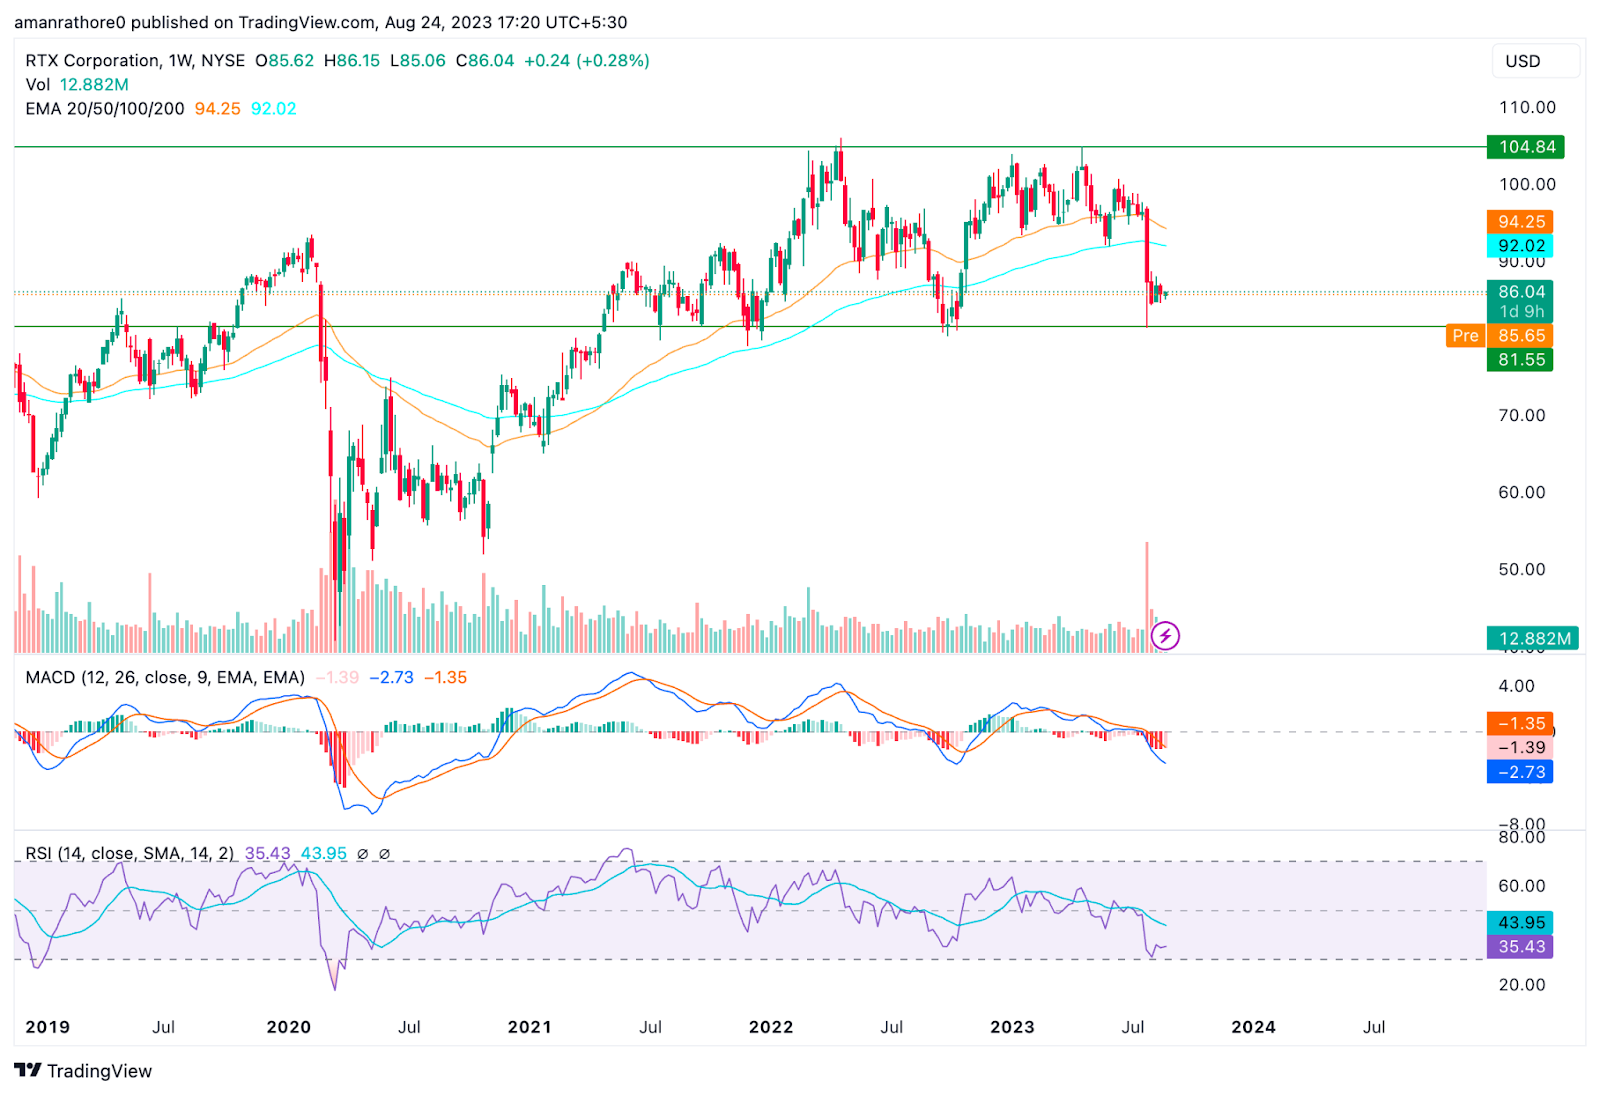
The weekly timeframe chart analysis of the stock price of Raytheon Technologies Corp. shows that the price is currently in a downward momentum.
Although the price has been steadily rising for a very long time, it has occasionally seen drops of more than 56% in a short amount of time. After a while, the price turned around and reached a peak of $106.03.
Currently, the price is moving in a range of $105-$91 levels and it has formed a parallel channel pattern. By looking at the overall structure of RTX, one can determine that the price of Raytheon (RTX) is losing some strength and is highly likely if the price breaks below the support level.
If the price fails to break the below level, it might continue consolidating in the range.
The dividend yield ratio of Raytheon Tech Corp. (NYSE: RTX) is 58% and its current dividend yield is 2.4%.
The P/E ratio of Raytheon Tech Corp. (RTX) is 25.8x which is below the peer-to-peer average P/E.
Raytheon Technologies Corp. (RTX) Stock Price Analysis
EMA
RTX is trading below 50-day, and 100-day EMAs on a weekly basis. This indicates that the stock price of RTX is in the fall. The price of the RTX is likely to fall in the upcoming days.
MACD
Raytheon Technologies’ MACD line has moved below the signal line on a weekly basis, indicating a bearish signal. Red histograms indicate an increase in bearish momentum. This indicate that the price of Raytheon Technologies price is likely to fall further in the near future.
RSI
Raytheon Technologies’ relative strength index (RSI) is at 37, and its 14-day SMA line is about 45, lower than the median. That’s a sign that the market is having a bearish momentum. This means the stock is losing momentum.
Volume Analysis
As per the charts above, the volume of the stock of Raytheon Technologies is steadily decreasing over time, which is a bearish sign for the price movement of the stock. The decreasing volume of the stock indicates less participation of retailers in the market.
Conclusion
As per the analysis, Raytheon Technologies Corp. (RTX) is having a bearish momentum. The price of the stock is falling and earning of the stock is also decreasing. The indicators are also bearish on the stock.
Therefore, the price of the RTX stock is going to decrease in the upcoming days.
Technical Levels
- Support Level: $81
- Resistance Level: $104
Disclaimer
The views and opinions of the author, or anyone named in this article, are for informational purposes only. They do not offer financial, investment, or other advice. Investing or trading crypto assets involves the risk of financial loss.




