
 Minter
 Bittensor
 Quack AI
 NEAR Protocol
 Pons
Pons Pearl
Pearl Bitcoin
- The bears have taken the stock to its time low but the bulls are making a re-entry
- The stock price is moving towards its immediate resistance zone while the 50 EMA is coming down
- The MACD and RSI have given a slight bullish signal.
The SFOR stock price started falling back in early February this year after making a high of £249. The bulls tried to go past the levels of their 200 EMA but the bears were active at that level.This could be explained by the relative strength index (RSI), as it touched its oversold level of 70.
This bearish trend continued as the stock broke major support levels one after another. In march of this year, a major support of £174 was broken, and subsequently, another support of £137 was broken in May. In July, the stock prices were rising as the bulls finally seemed to make a re-entry.
However, these bullish days would not last for long. In mid-July, the digital advertising company announced that the earnings of 2023 may be lesser than expected. This announcement led to a sell-off in the stock price, primarily because advertising revenue contributes to over 60% of the company’s profits.
Technical Analysis and Price Prediction
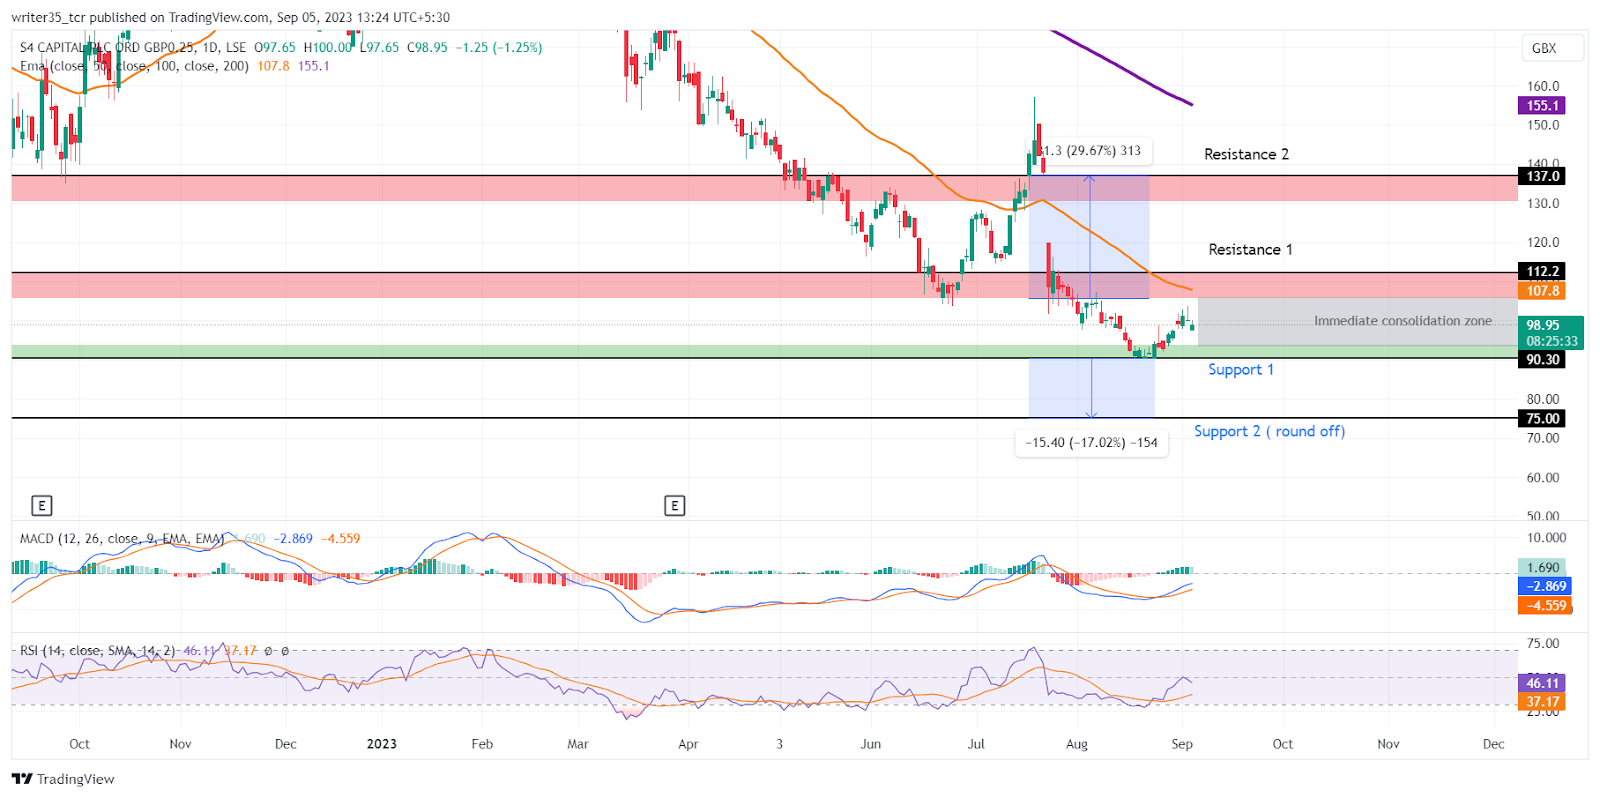
Currently, the SFOR stock price is trading at £99.5, rebounding from its all-time low of £90.10 observed in August. The immediate support for the bulls is located at £90.3, which coincides with the all-time low. If the bears manage to breach this support level, a secondary support zone can be identified around the £75.0 mark.
On the resistance side, there are two notable levels. The immediate resistance is positioned at £112, while the second resistance stands at £137. Interestingly, the exponential moving averages (EMAs) are intersecting between these resistance levels. The 50 EMA, situated at £107, is positioned below the 200 EMA. Which hovers above the second supply zone at £136.
The MACD indicator has recently shown a slight bullish signal following a bullish crossover with its EMA in late August. At present, the MACD line is at -2.86, with its EMA at -4.58, indicating strength in the bullish sentiment.
Additionally, other indicators like the relative strength index (RSI) have witnessed an uptick after previously touching oversold levels in mid-August. The RSI has made a bullish crossover with its SMA line at the end of August, pushing the RSI line above the neutral zone at 46, while its EMA lags behind at 37. These indicators suggest a potential for bullish momentum in SFOR stock.
What is the Price Prediction for SFOR Stock
The SFOR stock price prediction will be bullish until the stock reaches its resistance level. After that, the momentum of the bulls will decide the price action as the 50 EMA will possibly come near the resistance level. Therefore, a strong push from the bulls will be required to maintain the uptrend.
Technical Levels
Support:£1053, £1002
Resistance: £1116, £1188
Disclaimer
The views and opinions stated by the author, or any people named in this article, are for informational purposes only. They do not establish financial, investment, or other advice. Investing in or trading crypto assets comes with a risk of financial loss.




