
 Zcash
Zcash Sui
Sui Celestia
 Quantus
 Injective
 Hyperliquid
 LayerZero
- PayPal Holdings’ MACD line is forming a red histogram.
- PYPL stock does not pay any dividends to its shareholders.
- PayPal Holdings, Inc. stock gave a negative return in the previous year.
PayPal Holdings, Inc. (NASDAQ: PYPL) is involved in the creation of digital payment technology platforms.
PYPL stock is currently in a downward trend. PYPL stock recently reversed from a critical resistance level, forming a pattern of lower lows.
The stock is currently trading at $57.30, with a decline of -2.15% in today’s market session. The stock has a share float of 1.08 billion shares, and ROIC has declined by 8.5% YoY.
PYPL stock does not pay any dividends to its shareholders. This indicates that the company might not be performing well financially, and retail investors might lose interest in making new positions.
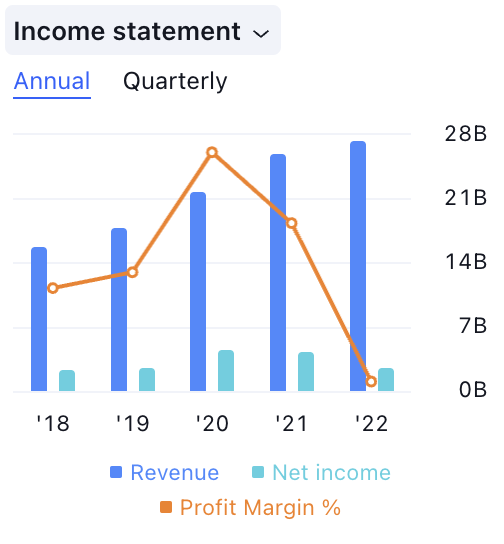
Analyzing PayPal’s income statement, the profit margin percentage has decreased along with the net income. In 2021, the profit margin was 16.3%, which dropped to 8% in 2022. This indicates a weakening position for the stock.
Since reaching its peak, the PYPL stock price has fallen by almost 80%. Presently, it is moving within a descending triangle pattern, signaling a weak pattern and an overall negative structure for the stock. This increases the possibility of a price decline in the future.
Over the last year, the stock has shown a return of -34%, and in the last six months, the return was 21%. The price has consistently registered lower lows, underlining the bearish trend.
The technical indicator summary shows a strong sell indication for PYPL stock.
PayPal Holdings, Inc. (PYPL) Stock Price Analysis
PAYPAL by writer50_tcr on TradingView.com
Regarding the PYPL stock price, both the MACD line and the signal line are positioned below the zero line. Furthermore, there is a visible increase in the red histogram, indicating ongoing downward pressure and pointing to a possible decline in the stock price in the future.
The RSI line, along with the 14-day SMA line, is in close proximity to the 30 level. Both lines are in a weak zone, suggesting the potential for future price decreases.
Conclusion
Based on the analysis, it appears that PayPal Holdings, Inc. (PYPL) stock is presently on a downward trajectory and has the potential for further decline. The price consistently forms a pattern of lower lows, and various indicators provide negative signals. This points to the likelihood of continued price decline in the coming days.
Technical Levels
· Support Level– $55.
· Resistance Level– $65.
Disclaimer
The views and opinions of the author, or anyone named in this article, are for informational purposes only. They do not offer financial, investment, or other advice. Investing or trading crypto assets involves the risk of financial loss.




