
 Quack AI
 Quant
Quant Pudgy Penguins
 Ondo
Ondo NEAR Protocol
 Starknet
 Bittensor
- The price is currently trading at $149.32 while observing an increase of 1.52% during the intraday trading session.
- The AXP stock price has faced resistance from the 50-day and the 200-day EMAs.
American Express Company (NYSE: AXP) is a bank holding company. It was established on March 18, 1850, in New York, United States. It is a global payments company that provides card products and travel-related services to individuals, small and middle businesses, and corporations.
An Overview of the Company/Stock Performance
In the year 2022, the company has performed well as compared to the previous year. It has increased its revenue by 15.71% and generated a total revenue of $50.68 Billion with a net income of $7.51 Billion.
The firm’s performance has been average when compared to the last few quarters. On the other hand, the AXP stock price has fallen more than 18% after it reported its quarterly revenue as $13.86 Billion, which reflects a 6.71% year-to-year growth.
The earnings per share (EPS) of the stock is $9.83 with a price-to-earnings (P/E) ratio of 15.19. The firm has a current yield of 1.61% and pays a dividend of $2.40 per share.
AXP stock holds a total market capitalization of $108,568,766,910. It has been trading with an average volume of 4,516,011.
Technical Analysis and Prediction of the AXP Stock
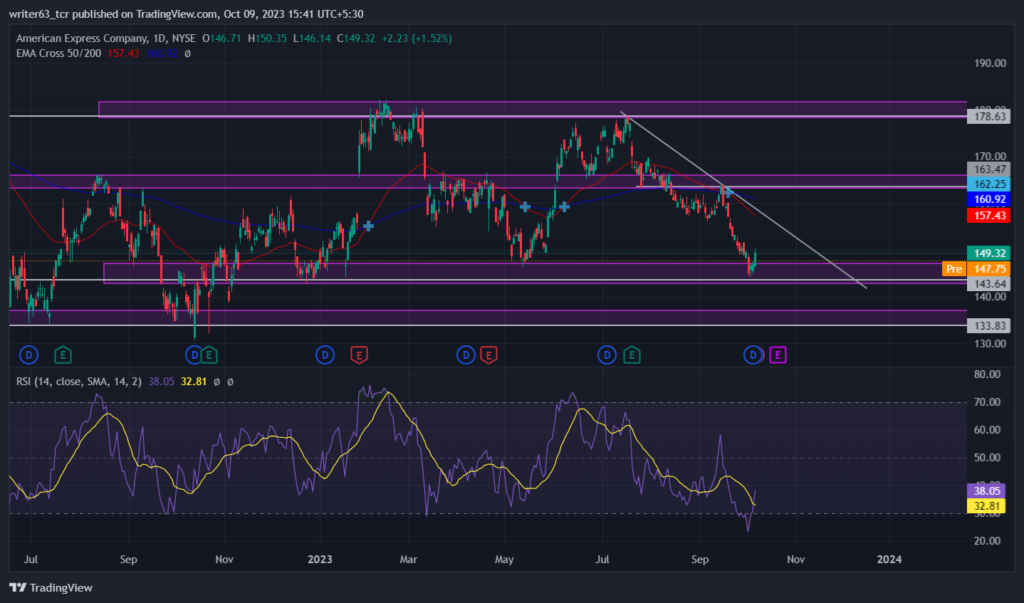
AXP price has been trading in an uptrend since October 2022. Recently, the price dropped more than 11%, after the bearish crossover of the 50-day EMA and the 200-day EMA. Both the EMAs gave resistance to the price.
At press time, the price is trading at $149.32 while getting support from the $143.64 level. It has faced resistance from the trendline that has formed above. In the last trading session, it formed a strong bullish candle that reflects the buyers’ interest. The support and resistance levels for the price are $133.83 and $163.47.
Additionally, the relative strength index (RSI) is indicating strong momentum. The RSI line is moving up from the oversold region below the 30-mark, which suggests that the bulls are gaining control of the situation. This could further support the idea of a potential bullish trend.
Conclusion
The AXP stock price has arrived at the point of interest for the bulls. The buyers are entering at the current level. The price prediction for this stock will be bullish. So, if the price manages to give a breakout of the trendline formed above, it may rise to the $163.47 resistance level. If it also breaks above this resistance then it may reach up to the $178.63 level.
Technical Levels
- Resistance Levels: $163.47 and $178.63
- Support levels: $143.64 and $133.83
Disclaimer
The views and opinions stated by the author, or any person named in this article, are for informational purposes only. They do not establish financial, investment, or any other advice. Investing in or trading crypto and stocks comes with the risk of financial loss.




