
 hi
hi Covenant x402
 Boomer
 Claudia
 Lighter
 NEAR Protocol
 Injective
- After a fall of over 15%, the TMO stock price is trading near the buyers’ point of interest (POI).
- The stock price is currently consolidating between $591.81 and $476.95.
Thermo Fisher Scientific Inc. (NYSE: TMO) is a Biotechnology Company listed in the US securities. It was established in 1956 in the United States of America. It is a global biotechnology product development company that supplies scientific instruments, reagents, consumables, and software services.
Recent Highlights of the Company and Stock Performance
For the last few years, the company has been performing well according to the financial statements. In the last year’s report, it had generated revenue of $44.92 Billion, which increased by 14.55% compared to the year 2021.
In the month of June 2021, the TMO stock price surged up to more than 50% from the $440.21 level. The stock reached an all-time high at $672.34, after which there was a persistent bearish sentiment with sellers consistently shorting the price. Despite this, the price entered a consolidation phase instead of experiencing a continuous decline.
TMO stock has a one-year target of $630.00 and a yearly price range from $609.85 to $475.77. It holds the price to earnings (P/E) ratio as 34.08 with the earnings per share (EPS) at $14.63. The company has an annual dividend of $1.40 per share.
The total market capitalization of TMO stock stands at $192,415,259,329 with an average volume of 1,324,848.
Technical Analysis and Price Prediction of the TMO Stock
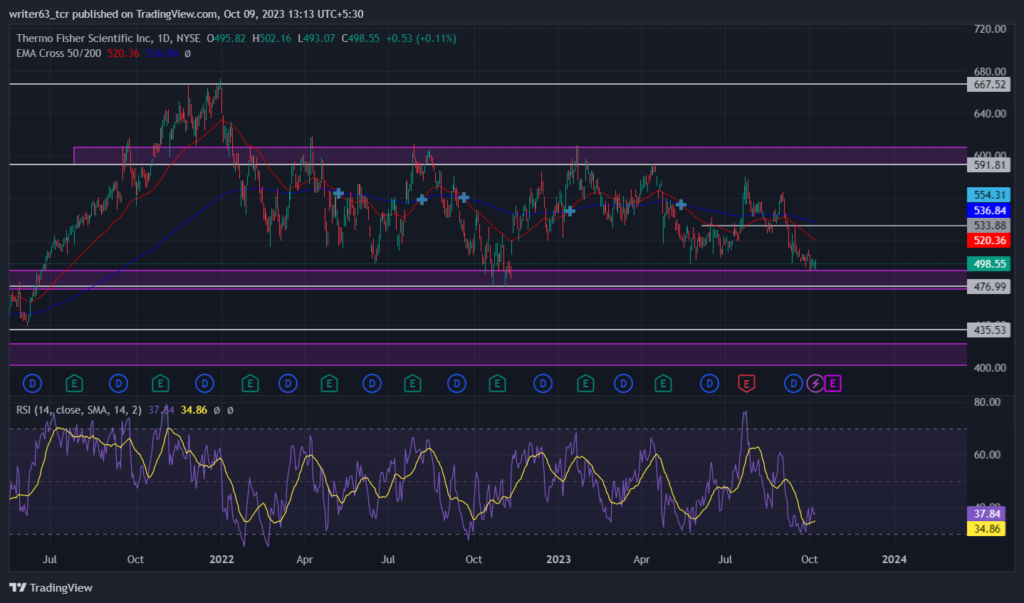
The TMO stock price has been consolidating since early 2022. In the wider outlook of the chart, the price is currently performing below the 50-day EMA and the 200-day EMA. This indicates a short-term downtrend. Both EMAs are sloping downward, with values at $520.36 and $536.84, signaling a bearish trend within the price range.
At present, the stock price is trading at $498.55, near the major support level at $476.99. It has the $533.88 level as an immediate resistance. In the last four trading sessions, the price has formed some bullish candles which reflects the bulls’ presence at that level. The other support and resistance levels are $591.81 and $435.53.
On the other hand, the relative strength index (RSI) is showing some bullish divergence indicating that the buyers are approaching at this level. The RSI is sloping at 37.84 after making a bullish crossover with the signal line.
Conclusion
The TMO stock price has been trading sideways. The price for TMO appears to be trading in a demand area, indicating a bullish trend. If the price manages to break above the $533.88 level, it has the potential to rise to $591.81. This could lead to a new all-time high for the stock, making it an interesting opportunity for investors.
Technical Levels
- Resistance Levels: $533.88 and $591.81
- Support Levels: $476.99 and $435.53
Disclaimer
The views and opinions stated by the author, or any person named in this article, are for informational purposes only. They do not establish financial, investment or any other advice. Investing in or trading crypto and stocks comes with the risk of financial loss.




