
 NEAR Protocol
 Pyth Network
 Uniswap
 Pearl
Pearl Quantus
 Aerodrome Finance
 Starknet
- The Merck & Company Stock price has given a breakdown From the symmetrical triangle pattern.
- Rating firm Truist Securities maintained the buy rating on MRK stock.
- This company has witnessed a fall of over 250% (YOY) in its net income in Q2.
The current market price of the MRK – $104.50
The MRK stock has surged for 4 consecutive trading sessions. The price has taken a strong support near the year’s low level. It is a psychological level that works most of the time. The stock price has been in a strong uptrend since 2009, it has witnessed a jump of over 800% to date.
The MRK stock price has changed its bullish structure to a bearish one. It has now formed a lower-high and lower-low pattern, which is a very well-known bearish chart structure. The possible reason for this shift in sentiment can be the poor financial performance of the company.
The company has posted a declined net profit (YOY) in the previous 4 quarters. If we consider the Net debt of the company, it has risen significantly in the last 2 quarters which is a matter of concern for the company. The management should consider some necessary actions which can control the debt soon.
An Outlook of the Merck & Company Stock’s Chart
The MRK stock price has formed a symmetrical triangle pattern on the daily chart which is marked in yellow. It was recently broken by the price and the stock showed a good decline after that. However, the stock has taken support and tried to reverse the price. Currently, the price is trading very close to the trendline it has breached before. It is highly possible that the share price can resume the downward momentum from here.
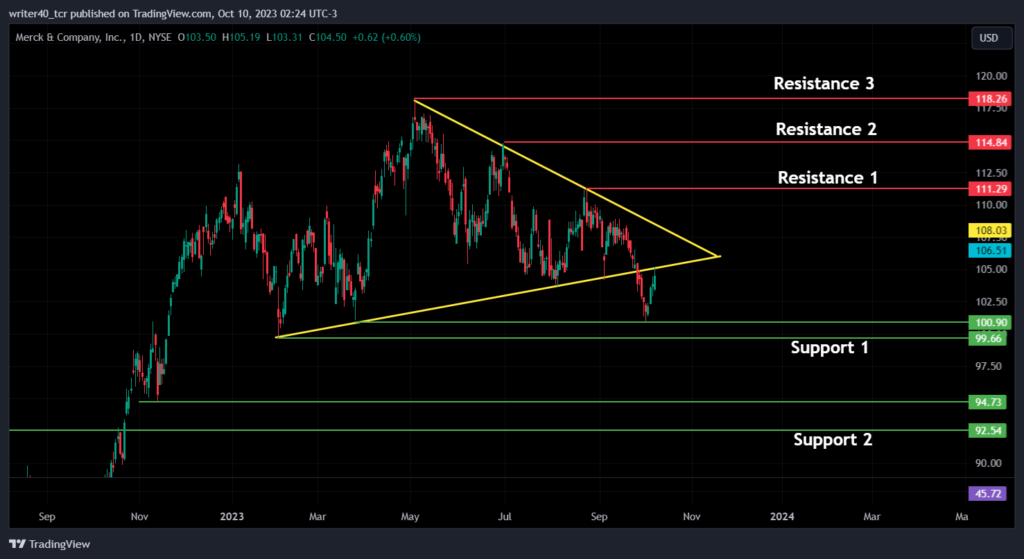
The price has taken support from the previous support level of $100, which is also the lowest level of this year. Apart from this, the price can take support from the level of $95 and $92.5.If we consider the resistance levels for the stock, they are present at $111, $115 and $118 levels.
A Quick Synopsis of Indicators
Exponential Moving Averages
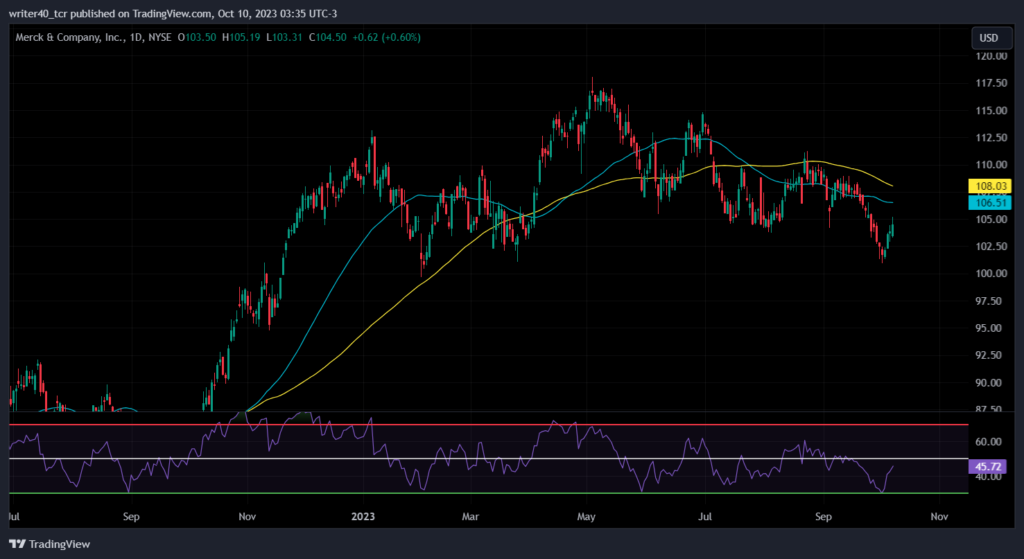
The stock price is trading below the 50-day and 100-day Exponential Moving Averages. It is a bearish sign for the stock. The curve of the EMA is flat which indicates that the share is consolidating right now. The EMA has seen a bearish crossover in the month of July 2023.
Relative Strength Index
The Relative Strength Index is currently placed below 50 level, which shows that it is currently having a bearish momentum. However, the slope of the RSI is rising indicating that the bulls are slowly gaining momentum in their side.
Conclusion
The MRK stock has been declining because of poor financial reports. If the company continues this poor performance then the stock can see a deep downside. If the price sustains this upmove, then it may go towards the level of $111 and $115, if the price breaks the support level of $100, then it can move towards the level of $95.
Technical Level
Resistance – $111 and $115
Support – $100 and $95
Disclaimer
The views and opinions stated by the author, or any people named in this article, are for informational purposes only. They do not establish financial, investment, or other advice. Investing in or trading crypto assets comes with a risk of financial loss.



