
 Minter
 Quack AI
 Starknet
 NEAR Protocol
 Sui
Sui Hyperliquid
 Bittensor
- The CVX stock price is in an uptrend with a weekly volume of 42.709 Million.
- CVX price received reinforcement from the 50-day and the 200-day EMAs.
Chevron Corporation (NYSE: CVX) is the second-largest integrated company in the world. It is an American multinational energy corporation headquartered in California, United States. The company produces crude oil, natural gas, and many other essential products through its subsidiaries and affiliates.
An Overview of the Financials
According to the company’s statements, it has performed well in the year 2022. The firm generated a revenue of $235.92 Billion during this period, which reflected a year-over-year change of 52.14%.
In the second quarter of 2023, the firm observed a decrease of -28.11% in its revenue compared to June 2022. On the other hand, the CVX stock price surged almost 13% since the month of July.
Furthermore, the company has paid an annualized dividend of $6.04 while the current yield is at 3.68%. The one-year target for the stock stands at $187.00 with a yearly range between $189.68 and $149.74.
CVX stock holds a total market capitalization of $306,340,250,465 with an average volume of 9,831,176.
Technical Analysis and the Price Prediction
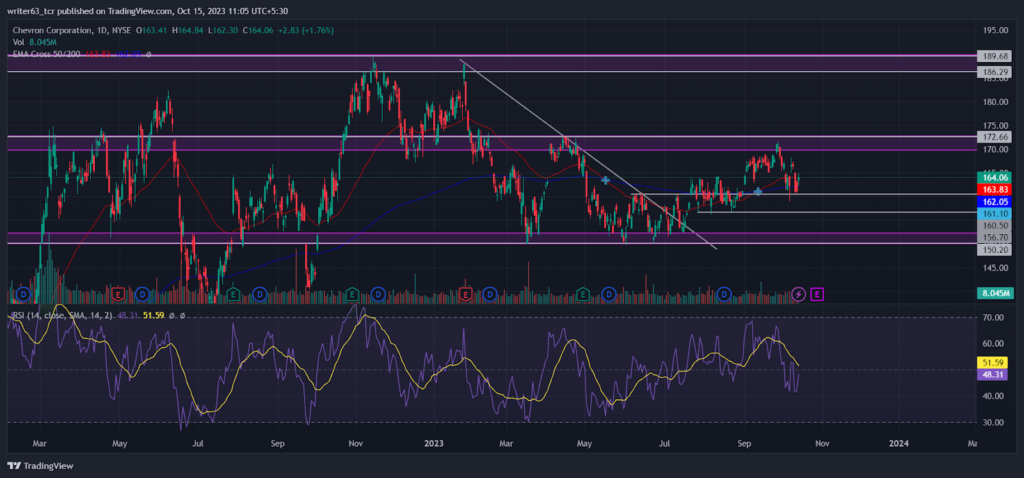
The stock price has been in an uptrend since June 2023. According to the oscillators, the 50-day EMA has made a bullish crossover with the 200-day EMA at $161.10. This indicates that the buyers are more active than the sellers in the current market phase. At present, the 50-day EMA is at the level of $163.83 while the 200-day EMA is at $162.05.
At press time, CVX stock is trading at $164.06 after taking support from the $160.50 level. In the last trading session, the price formed a bullish candle, after creating a double-bottom pattern at the support level. Now, it is moving toward the immediate resistance level of $172.66, which shows that the bulls have taken control over the price. However, if they succeed in breaking above the $172.66 level then, the price may rise to the resistance level at $186.29.
On the other hand, the relative strength index (RSI) has formed a bearish divergence near the resistance level. The RSI is sloping at 48.31 below the signal line, indicating that there is greater selling pressure.
Conclusion
The price prediction for the Chevron Corporation (NYSE: CVX) stock is bullish as per the technicals. It is trading in an uptrend by consistently making higher highs and higher lows. Recently, it formed a double-bottom pattern at the support level of $160.50 and is moving toward the immediate resistance level at $172.66. However, if the stock price somehow closes below the $150.20 level, then it may initiate a bearish rally.
Technical Levels
- Resistance levels: $172.66 and $189.68
- Support Levels: $156.70 and $150.20
Disclaimer
The views and opinions stated by the author, or any person named in this article, are for informational purposes only. They do not establish financial, investment, or any other advice. Investing in or trading stocks comes with the risk of financial loss.




