
 Bitcoin
 Pearl
Pearl Starknet
 Zerebro
 NEAR Protocol
 Solana
 Quantus
- The CME share price is currently trading at $220.06.
- The company stock has been on a 9-day winning streak.
CME Group, Inc. (NASDAQ: CME) was founded in 1898 and operates a derivatives financial exchange. It offers future and option products for risk management. It helps its clients to trade futures, options, cash, and OTC markets with optimized portfolios and analyze data.
Companies Raising Their Target Pirce in the CME Share
Many companies such as Citigroup, Morgan Stanley, JP Morgan, Barclays, and others have raised their price target. The company had formed back-to-back bullish candles in the last 9 trading sessions and increased its share price. It led the majority of the companies to revise their previous target as the company share price was in a boom.
CME Group Inc. (CME) Stock Analysis
In the trading session, the CME share price closed its intraday session at $220.06 with a gain of 1.36%. it traded with a volume of 1.952 Million with a market capitalization of 79.166 Billion USD.
Is CME Share Price Signalling for A Pullback in its 1-Day Chart?
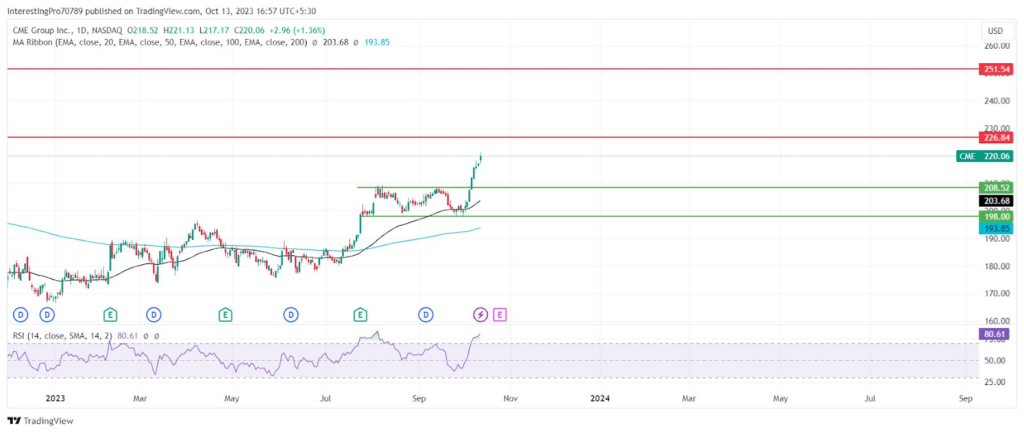
CME’s price has been in a continuous bull run for the last 9 trading days where its share price increased by 10.20%. It was the longest winning streak for CME stock since February 2021. Its share price has recently given a breakout of $226.84 resistance in the middle of its 9-day bull run. Currently, the share price is sustaining above the $226.84 level. That level will act as a support now.
The 50-day EMA (black line) and 200-day EMA (blue line) are trading below the price and have started to trend in the upward direction. It shows the bull’s presence and strong hold over the price. However, both the EMA lines are trading far from the price. It indicates the price can fall to retest EMA lines.
The RSI line is also in the over-bought territory which indicates a pullback is due in the CME stock’s 1-day chart. Thus, the price could be seen falling or taking a pullback in the upcoming trading days.
For the past 9 trading sessions, the price has been bullish without any pullback. Thus, the bullish rally must have gotten weaker as it has been in a bull run for so many days. It is also trading just below its $226.84 resistance. The indicators are also showing signs of a fall in the share price in the short term.
The chances of the price facing resistance from the $226.84 can increase. If the stock faces rejection from this level, it may fall to retest the 50-day EMA and $208.52 support level. As long as it is trading or sustaining above the $208.52 level, the bullish sentiment will be there. For the long-term continuation of the bull run, it must give the breakout of $226.84 resistance. Thus, it may rise to its next resistance at $251.54.
However, for the price to be in bearish sentiment it must give the breakdown of the $208.52 level. Thus, it may fall to its next support at $198.00.
Conclusion
The overall trend of the CME share price is bullish as it commences the bull run for the last 9 trading days. The indicators are showing signs of weakness in the price, which indicates a short-term fall. The price may fall to its $208.52 support. As long it is sustained over the $208.52 level, the bullish sentiment will be there.
However, for the continuation of the bull run, it must give the breakout of the $226.84 level. Thus, it may rise to its next resistance at $251.54. For sellers to take the control of price, they must close the price below $208.92. After that, the price may fall to its next support at $198.00.
Technical levels
Resistance Levels: $226.84 and $251.54.
Support Levels: $208.52 and $198.00.
Disclaimer
The views and opinions stated by the author or any other person named in this article are for informational purposes only. They do not provide financial, investment, or other advice. Investing or trading comes with a risk of financial loss.



