
 Boomer
 Pearl
Pearl Covenant x402
 Claudia
 Bitcoin
 hi
hi NEAR Protocol
- The market valuation of Smart Sand Inc. stock on the NASDAQ is valued at $91.941 million. The prevailing market rate of SND stock is valued at $2.23.
- Charles Young established the Smart Sand Company in 2011.
- Leading industrial sand provider Smart Sand Inc. primarily serves clients in the oil and gas sector.
Smart Sand Company (NASDAQ: SND) is a high-quality Northern White raw frac sand producer, which is a pure-play, low-cost proppant. It is used to increase hydrocarbon recovery rates during hydraulic fracturing of oil and natural gas wells.
Smart Sand Company: Financial Statements Analysis
On February 28, 2023, the company released its annual report. According to the reports, the company’s overall revenue for 2022 was $255.74 million. The company’s gross profit in 2022 was $12.40 million. The only lucrative fundamental heads were the described ones.
In 2022, the business faced an operating loss of $3.13 million. In 2022, its net loss was $703.00K. Compared to the other headings of the financial accounts, these two were not profitable in the year 2022.
Technical Index
The RSI line is below the 50 level which means the stock losses are more than the gains in the price. The EMA-100 days indicate buying action at the $2.01 price level. It’s 200 days- EMA implies buying at the $1.96 price level.
The 100 Days- SMA provides buying at a $1.19 market price. Its SMA- 200 Days shows buying action at $1.85.
Technical Analysis of SND Stock
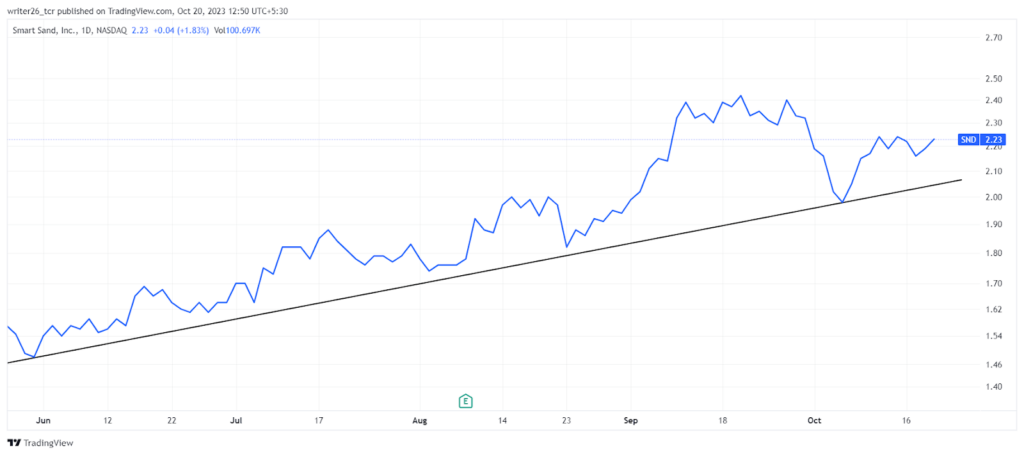
The SND stock has been doing well in the 1-D analysis since June 2023. It is moving with an upward momentum. The presence of numerous support points on the line contributes to its strength. It is down today by 1.83%. It has decreased by 78.35% overall. The shareholders have lost 50% of their investment value over the last 5 years.
The all-time high in SND stock was made on February 23, 2017, which was around $21.
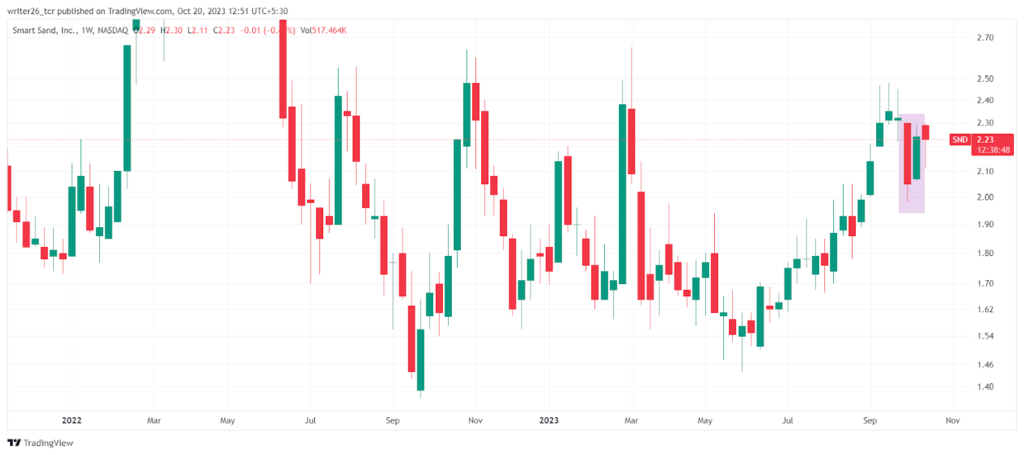
We should wait till the next candle to predict whether the forecast was right or wrong. Bullish market sentiment is currently appearing in the SND stock.
The pattern implies that the price will continue to incline over the upcoming days. This pattern is a strong indicator of bulls dominating the stock in the upcoming trading sessions.
SND stock’s ROE (Return On Equity) in the three quarters of 2022 was-
– ROE in the First Quarter of 2022, was (21.05%).
– In the Second Quarter of 2022, ROE was (10.35%).
– ROE in the Third Quarter of 2022, was (6.29%).
Live Chart of SND
Conclusion
The SND stock price may rise by 3.50% in a few weeks. It implies that prices might approach the $2.32 mark. Over the last 30 days, there has been a 4.79% incline in the current market price volatility. Its trend might lift the same momentum in the future according to experts and analysis.
Technical Levels
- Support level- $2.09 and $2.41
- Resistance level- $1.91 and $3.27
Disclaimer
The views and opinions stated by the author, or any people named in this article, are for informational purposes only and do not establish financial, investment, or other advice. Investing in or trading crypto or stock comes with a risk of financial loss.




