
 Quack AI
 NEAR Protocol
 Pudgy Penguins
 Pearl
Pearl Quant
Quant Quantus
 Sui
Sui
- JP Morgan cut down the target price of American Telephone and Telegraph Company.
- The AT&T stock price has declined by over 20% from the annual high.
- It jumped by over 6% in the last trading session.
The AT&T stock price has not been able to rise for the past 5 to 6 years. It has breached the 10-year low level of $13.42 in July 2023. The stock price has surged by only 69% in 6 years from 2014 to 2020. It halted this upward journey in 2019 when the price created an all-time high level of $22.92 in November.
AT&T stock, after February 2020, started this downward journey and it has lasted till now. However, the stock price has shown some pullbacks in between but it didn’t last much. If we calculate the overall fall of the year 2023, then the stock price has fallen over 32% from highs. It created a 10-year low of $13.18 on 18 July 2023.
This stock has maintained its previous rating of “NEUTRAL” on the stock. Along with that, it has also cut down the target price from $18 to $17. It can impact the stock price slightly on a negative side. However, the price has surged by over 6% in the last trading session, but it has created a strong bearish reversal candle on the chart.
Synopsis of the AT&T Stock Chart
AT&T stock has formed a downward-sloping trendline on the daily chart. It has reacted very strongly from that level. The stock price has formed an M-Pattern or in other words double bottom pattern on the daily chart.
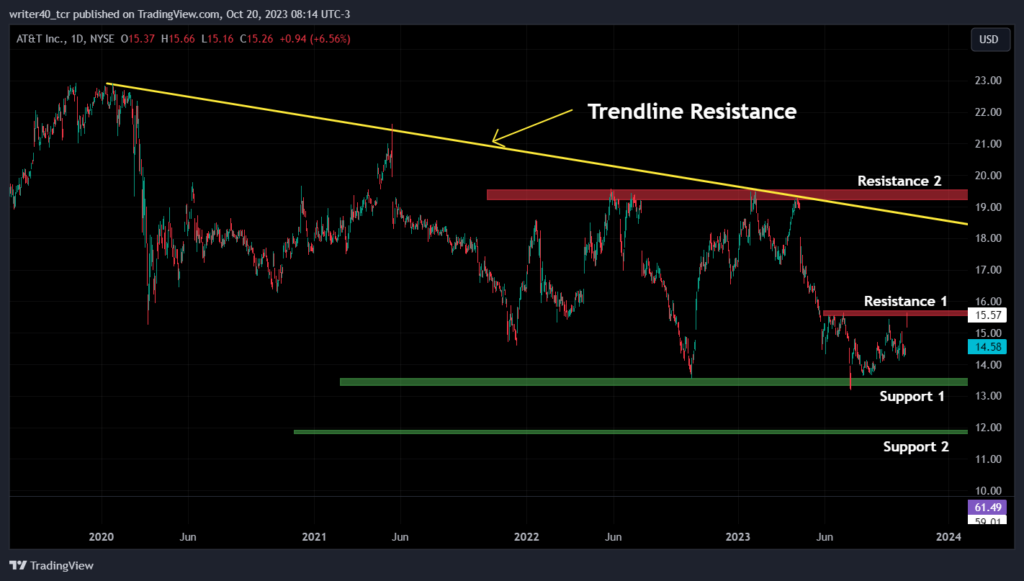
The AT&T stock price is trading close to the resistance level of $15.65, which is marked as resistance 1 on the chart. The trendline resistance level is present at the level of $18.6 and resistance 2 is present at the level of $19.55. Considering the support level of the stock, it is present at the level of $13.60 and the other support level is present at the level of $11.90.
A Quick Glance at the Indicators Used in the Technical Analysis
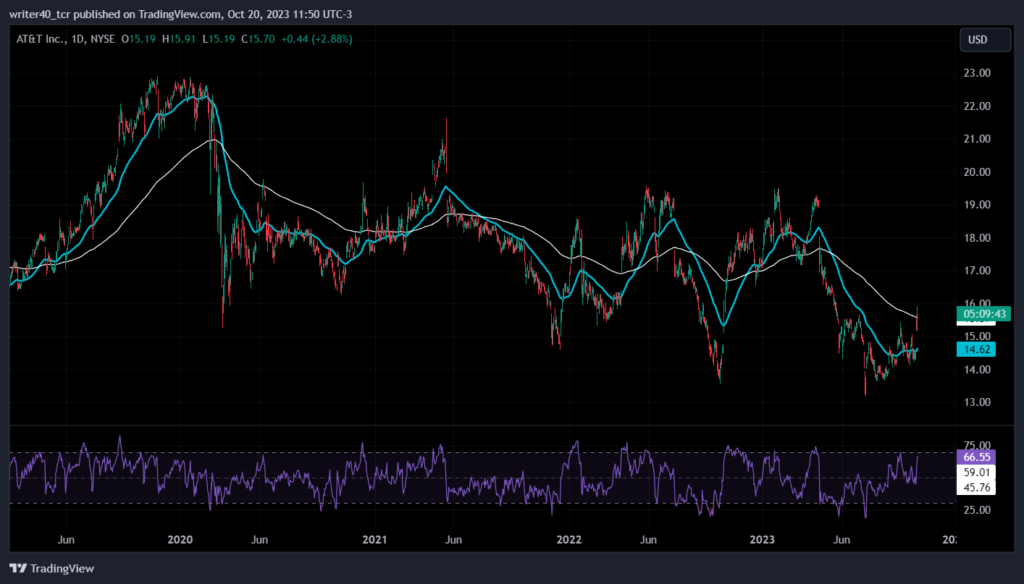
The price is currently trading between the 50-day EMA and 200-day EMA lines. Currently, it is struggling to close above the 200-day EMA. If it forms a strong bearish candle by touching the 200-day EMA line, it may then fall to the 50-day EMA. However, for sellers to take full control, they must close the price below the 50-day EMA. After which the price may continue to fall. The relative strength index is at 66.55, which is marked in bullish territory. The RSI line is sloping in the upward direction showing the price is facing high buying pressure. It indicates the bulls are currently influencing the price.
Conclusion
The AT&T stock price is trading close to the resistance level and has formed a bearish candle on that. If the price reverses from here, it can move towards the level of $13.60 and $11.90. However, if the price breaks the resistance level of $15.65, it can move towards the level of $19.55.
Technical Level
- Resistance – $15.65 and $19.55
- Support – $13.60 and $11.90
Disclaimer
The views and opinions stated by the author, or any people named in this article, are for informational purposes only. They do not establish financial, investment, or other advice. Investing in or trading crypto assets comes with a risk of financial loss.




