
 Covenant x402
 Doge Pepe
 Tetsuo Super Intelligence
 Claudia
 Boomer
 hi
hi Quantus
- The HD stock price is currently at $281.48.
- The price is indicating a stronghold of sellers over the price.
Home Depot Inc. (NYSE: HD) is a home improvement company. The firm sells building materials, home improvement products, and lawn and garden decor products. It also provides services like transportation rental and installation of home improvement products. It is one of the largest home improvement retailers in the United States with a market capitalization of $281.499 Billion.
Home Depot Inc. (HD) Stock Analysis
In the last intraday session, the HD stock price opened with a surge of 0.42% and closed at $281.48 with a total gain of 1.82%. The stock was recorded trading with a 24-hour trading volume of 3.075 Million in the last trading session.
HD Stock Price Analysis on Daily Timeframe
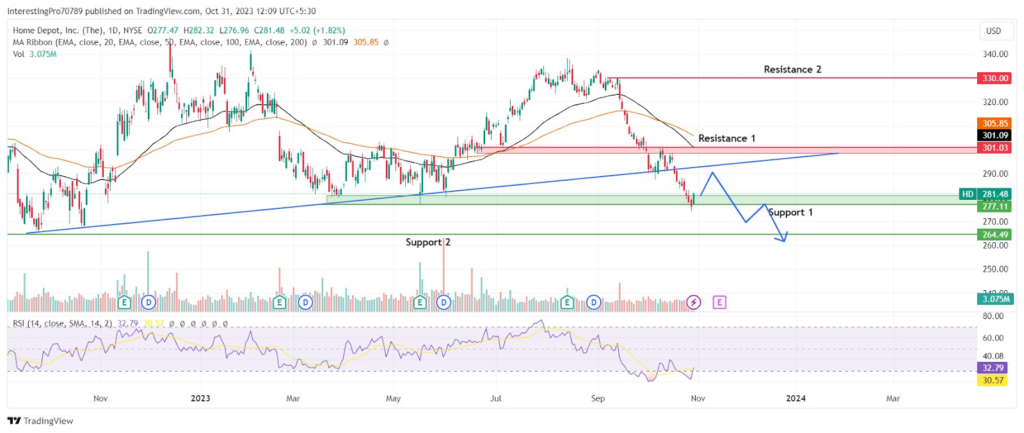
HD stock has been continuously declining for the last 30 trading days and has declined by 15.58%. Recently, the price has given the breakdown of the ascending trendline and fell to its $277.11 support zone. In the last trading session, the price took support from the $277.11 support zone and formed a strong bullish candle above the support zone.
The 50-day (black) and 100-day (yellow) EMA lines are above the price which is a bearish sign and they have also made a bearish crossover. However, the price is a bit far from the EMA line, which indicates that it can rise to retest the EMA lines. The relative strength index (RSI) is at 32.79, which is bearish territory and it recently came back from the oversold territory. This indicates that the price is in a recovery phase and could rise higher in the upcoming trading sessions.
The overview of the chart shows the sellers are dominating more than the buyers. However, the price could be seen rising in the upward direction as it is in a recovery phase. In the upcoming trading session, the price is expected to rise to retest the EMA lines and the $301.03 resistance zone. However, for the price to continue this rise in price, it has to reclaim the EMA lines and the $301.02 resistance zone. After this, it may rise to its next resistance at $330.00.
The chances are high that the price will continue its overall downtrend after the recovery phase is over. It may again retest the $277.11 support zone and if it breaks below this level, then it may continue its fall to its support at $264.49.
Conclusion
The HD stock price is in an overall downtrend. However, we could see a short-term rise in price because of the ongoing recovery phase. The chances of the continuation of the downtrend after the recovery phase is high for as long as the price is sustained below the EMA lines and the $301.03 resistance zone. So, sellers should wait for the price to make a bearish reversal candle after retesting the EMA lines, which would be a good entry point. Buyers should wait for the reclaiming of the EMAs and the $301.03 resistance level for a further upward move in price.
Technical levels
- Resistance Levels: $301.03 and $330.00.
- Support Levels: $277.11 and $264.49.
Disclaimer
The views and opinions stated by the author or any other person named in this article are for informational purposes only. They do not provide financial, investment, or other advice. Investing or trading in crypto comes with a risk of financial loss.




