
 Covenant x402
 Tetsuo Super Intelligence
 Doge Pepe
 Claudia
 Boomer
 Quantus
 Bitcoin
- Fiverr International Ltd.’s stock price has shown an increase of 11.3% in today’s market session.
- Fiverr International Ltd.’s actual earnings are more than the expected earnings.
- FVRR stock has a price target of $41.36 for the upcoming year.
Fiverr International Ltd. (NYSE: FVRR) creates an online marketplace facilitating the exchange of digital services, where individuals can both purchase and offer their skills. The company is active across various geographical regions, including the U.S., Europe, Asia Pacific, Rest of the World, and Israel.
The current market situation for Fiverr International Ltd. displays a somewhat uncertain price pattern, but there are indications of the price finding support.
As of November 8, 2023, FVRR stock has experienced an 11.3% increase. The stock typically boasts an average trading volume of 764K, and the volume is on the rise, which is noticeable through the larger candle formations.
The technical indicator summary provided by TradingView recommends a ‘buy’ signal for FVRR stock. Out of 26 indicators, 10 give a ‘buy’ signal. The moving averages summary also leans towards a ‘buy’ signal, hinting at a potential strengthening of the stock.
In the previous week, the stock’s price exhibited a recovery of more than 12%, signaling positive signs of resurgence.
In 2021, Fiverr stock reached its peak at $336, but subsequently entered a downtrend, witnessing a substantial decrease of nearly 94%. However, it identified a crucial support level at $20.2. Currently, the price hovers near its historical low and has demonstrated a turnaround after touching the support level. Further upward movement in price could signify a shift in the trend.
The target price for FVRR stock in the upcoming year is projected to be $41.36, which represents a substantial 70.6% increase from the current price. This serves as a positive signal for the stock.
Fiverr International Ltd. (FVRR) Stock Price Analysis
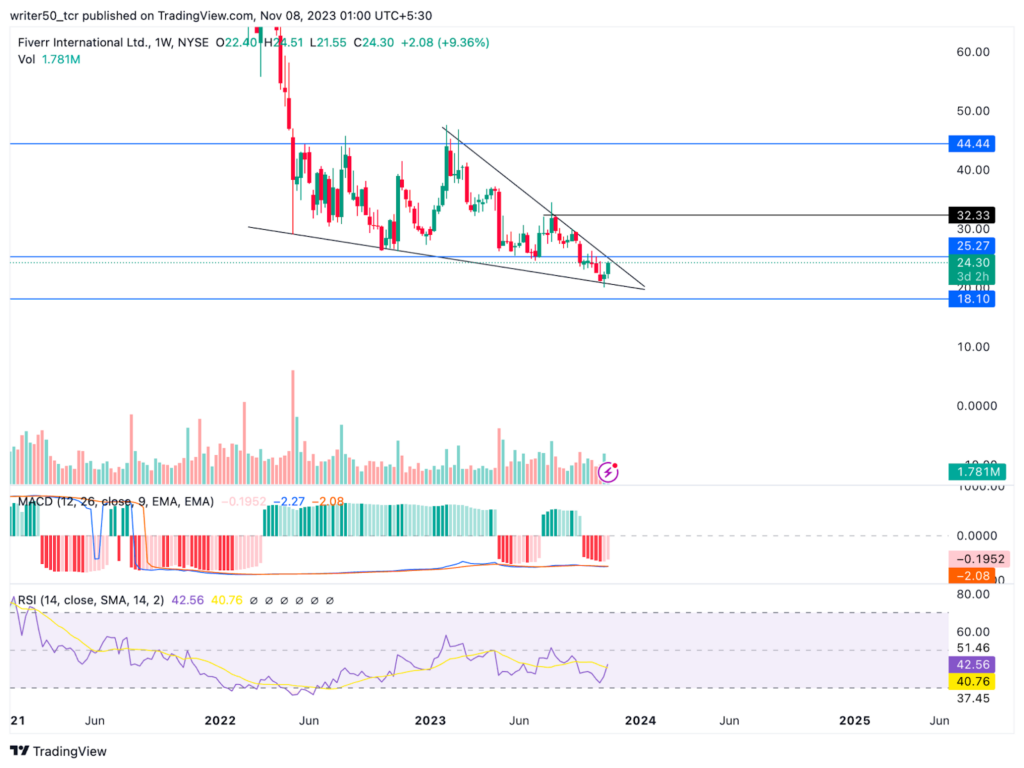
In the weekly perspective of Fiverr International Ltd., the MACD line is currently situated below the signal line. The MACD indicator displays an uncertain pattern, and confirmation of the future trend is contingent on a price breakout from the resistance level.
The broader market momentum for Fiverr International Ltd. seems robust, indicated by the present setup wherein the 14-day SMA line is positioned at 40 and itbeneath the RSI line which is at 42. This arrangement implies the possibility of a forthcoming price increase for the stock.
Conclusion
In conclusion, the FVRR stock price is showing signs of a trend reversal. The price reversed after taking support. The overall structure of the stock appears positive and the technical indicator summary is also exhibiting a ‘buy’ signal. The RSI is positive and the MACD indicator is showing uncertainty. Hence, the price of the stock is on the verge of a breakout and if the price breaks above the resistance, an uptrend can be seen.
Technical Levels
- Support Level- $21.06 and $18.10
- Resistance Level- $5.27 and $32.3
Disclaimer
The views and opinions of the author, or anyone named in this article, are for informational purposes only. They do not offer financial, investment, or other advice. Investing or trading crypto assets involves the risk of financial loss.




