
 IGNITION
 streamoors
 Injective
 NEAR Protocol
 Pearl
Pearl LayerZero
 Quantus
- Unity Software Inc.’s profit margin percentage has declined by -66.2%.
- Unity Software Inc.’s Return on Assets declined by -10.5% YoY.
- U stock is given a ‘sell’ signal by the technical indicator summary.
Unity Software, Inc. (NYSE: U) is involved in the creation of software for video gaming and offers software solutions for the generation, operation, and monetization of interactive, real-time content in both two-dimensional and three-dimensional formats for mobile devices.
The current movement in the U stock price indicates a downtrend, with the price maintaining a consolidated range.
The technical indicator summary underscores a ‘sell’ signal for U stock, with 13 out of 26 indicators delivering ‘sell’ signals, while only 3 present a ‘buy’ signal. Additionally, the moving averages summary strongly leans towards a ‘sell’ signal for the stock, heightening the likelihood of an impending price decline.
The average trading volume for U stock stands at 8.4 million, and the company’s earnings before interest, taxes, depreciation, and amortization (EBITDA) is currently around -$80 million, reflecting a decline of -44.9% YoY.
The Return on Assets for Unity Software Inc. in Q2 2023 is -15.7%, and it has receded by 10.5% on an annual basis.
In November 2021, the stock attained its peak at $210 before embarking on a substantial descent, ultimately declining by almost 88% and finding support at the $24 level. More recently, there are signs of a turnaround from the all-time low of $23.45, and the stock is presently trading within a defined range.
The overall structure of U stock displays a weak pattern with a pessimistic outlook, indicating the potential for a price reduction in the coming days.
Unity Software Inc. (U) Stock Price Analysis
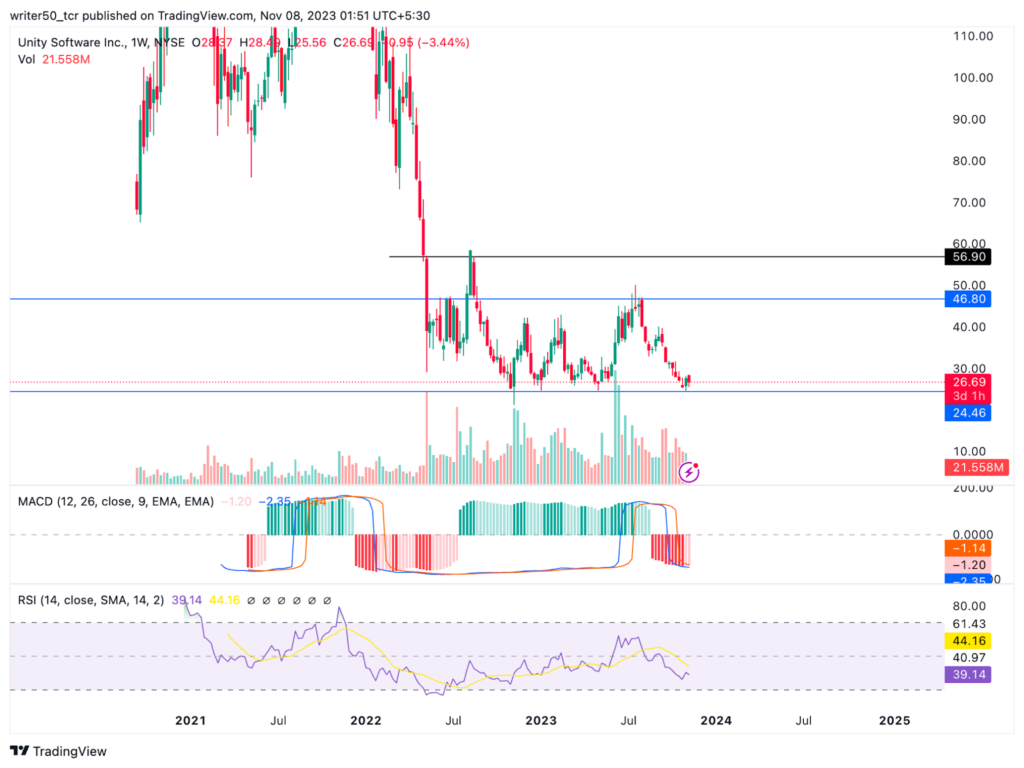
The prevailing market price of U stock is positioned beneath both the 50-day and 100-day exponential moving averages (EMAs), signifying a bearish sentiment and the potential for a price drop ahead.
Furthermore, an examination of the MACD indicator in a weekly context reveals that the MACD line is located beneath the signal line, which points to a bearish trend. The presence of a negative crossover and a red histogram further support the likelihood of a price decrease for U stock in the immediate future.
Conclusion
The analysis indicates that Unity Software Inc. has established a frail framework. The price is currently on a downward trajectory, marked by the emergence of lower lows in the candlestick patterns. Additionally, the stock has yielded a negative return over the past year, and the indicators presently exhibit weakness. These combined factors elevate the probability of an upcoming price decline.
Technical Levels:
· Support – $24 and $21.10
· Resistance – $39 and $56.90
Disclaimer
The views and opinions of the author, or anyone named in this article, are for informational purposes only. They do not offer financial, investment, or other advice. Investing or trading crypto assets involves the risk of financial loss.



