Claudia
 Crawlerpad
 Bunker Mode
 Starknet
 Pearl
Pearl Quantus
 Pudgy Penguins

Aave price is hinting at a possible trend reversal. A weekly TD Sequential buy signal has just appeared on the chart. The signal emerges as the protocol posts record revenue, deposits, and loan activity. However, the token remains substantially below its historical peak.
Aaave Price TD Sequential Flashes Weekly Buy Signal
The primary development highlighted by Ali Martinez is the fresh TD Sequential “9” buy setup printed on the weekly timeframe. The indicator has historically aligned with notable pivots in Aave’s price action.
Weekly chart shows the AAVE price closing the first week of November around the $217 zone. The move followed a prolonged decline that began after the mid-August reversal.
This sequence produced a clear nine-candle downtrend into late October and early November, culminating in the signal. The candle preceding the signal formed near a local low just above $205. This marks the lowest weekly close since early summer.
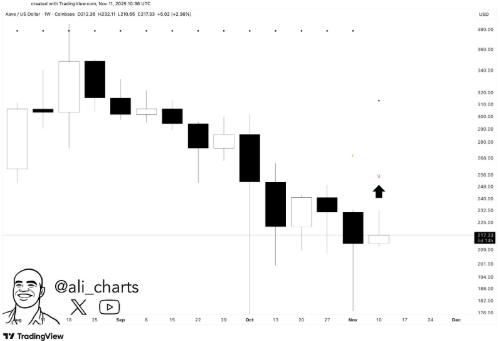
AAVE’s broader downward structure began in late September, where weekly highs near $250–$260 failed to hold. The formation gave way to a steady decline into October. The chart shows lower highs on September 23, October 7, and October 14.
It then takes a sharper dive during the week of October 21. The November 4 candle, however, narrowed in range. This suggests a slowing momentum into the TD-identified turning point.
The indicator is not a guarantee of reversal. However, its presence alongside a visible loss of downside momentum marks the first strong technical signal since the August peak.
Aave Fundamentals Show Historic Strength
As price consolidates, data from Blockworks Research indicates that Aave’s underlying fundamentals have reached all-time highs across multiple categories. The dashboard shows that weekly revenue exceeds $3 million.
The value marked one of the highest periods recorded by the protocol. Revenue accelerated sharply between late 2024 and early 2025. A clear upward trend is evident from Q1 2025 through November.
Deposits on the platform have also expanded significantly. The deposits chart shows total value deposited rising from below $30 billion in early 2024 to approximately $56 billion by Q3 2025.
This marks the protocol’s largest deposit base to date. The activity reflects consistent inflows over multiple quarters.
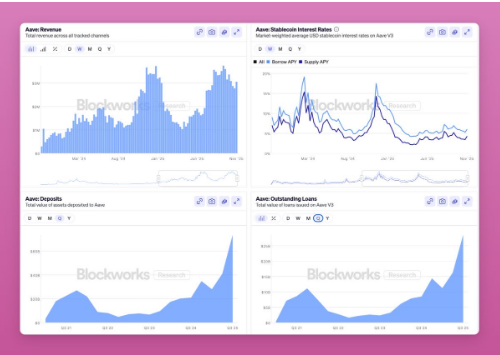
A similar pattern appears in the outstanding loans chart. Total loans issued on Aave V3 have increased from under $10 billion in Q1 2024 to over $25 billion by Q3 2025.
The rise indicates increased borrowing activity and steady demand for liquidity. It also shows expanding utilization across Aave’s markets.
Stablecoin interest rate metrics show a cooling structure through mid-2024 and into early 2025. This normalization typically coincides with improved borrowing conditions and higher borrower participation. This helps explain the jump in loan issuance.
These datapoints reinforce the analyst’s argument that Aave’s on-chain performance is hitting historic highs. This comes despite the token trading well below its former valuation benchmarks.
Aave Price Lags Behind Core Metrics Despite Growth
Despite the surge in fundamentals, AAVE’s price remains 66% below its all-time high from 2021. The token is also 39% lower than its December 2024 levels.
Intraday charts strengthen this contrast. On the one-hour timeframe, AAVE recently revisited an accumulation zone around $202–$206. The area held multiple rebounds throughout early November
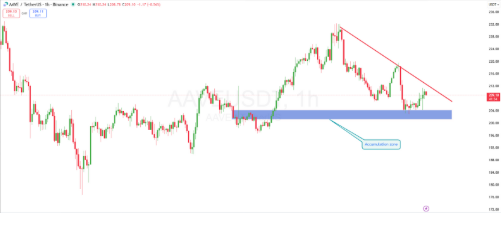
The chart also shows a clear descending trendline from the early-November highs near $228. The trendline has been acting as short-term overhead resistance. The rebound from the accumulation zone aligns with the broader weekly TD setup.
This reinforces the significance of the demand area. The price is trading within a narrow range. Consistent accumulation near $205 makes it a key short-term level for traders to watch.