Dacity Coin
 Injective
 NEAR Protocol
 Quantus
 Bitcoin
 Pearl
Pearl Sui
Sui

On‑chain data shows a new shift in Dogecoin’s exchange supply. Similar changes have signaled steep rebounds in past cycles. Dogecoin price net position on exchanges has only become positive once again, according to on-chain analyst Ali Martinez.
Glassnode data reveals a shift after months of heavy outflows. A tall green bar appeared in mid‑November 2025, signaling strong inflows. This reversal follows a steep Dogecoin decline. The price fell from above $0.30 in October to around $0.16–$0.17 in November.
During that decline, Dogecoin’s exchange net position dropped sharply. It plummeted to nearly minus 6 billion DOGE as massive withdrawals occurred.
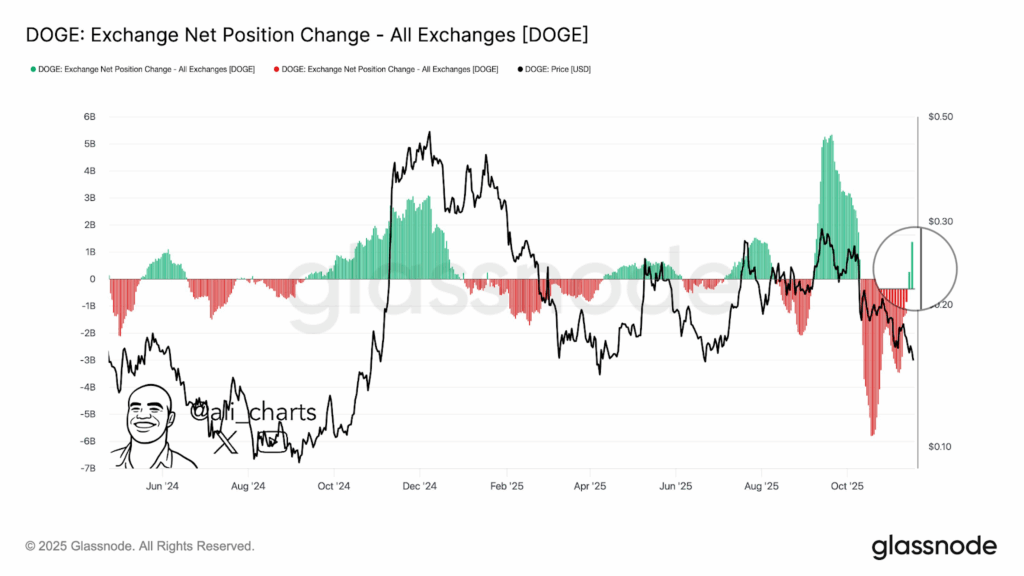
Ali indicates that steep price turnbacks accompanied previous positive changes recorded in this indicator. The current flip, consequently, enters a new stage in the existing Dogecoin cycle, and exchanges get net inflows again.
Cost Basis Heatmap Shows 27.4 Billion DOGE Anchored Near $0.08
More data reveals the locations of the last circulating supply motion, with dense clusters of ownership being displayed.
The strongest band is between $0.081 and $0.083, where holders have control of approximately 27.4 billion DOGE. This band is the most important level of support in the present cycle, according to the annotation made by Ali.
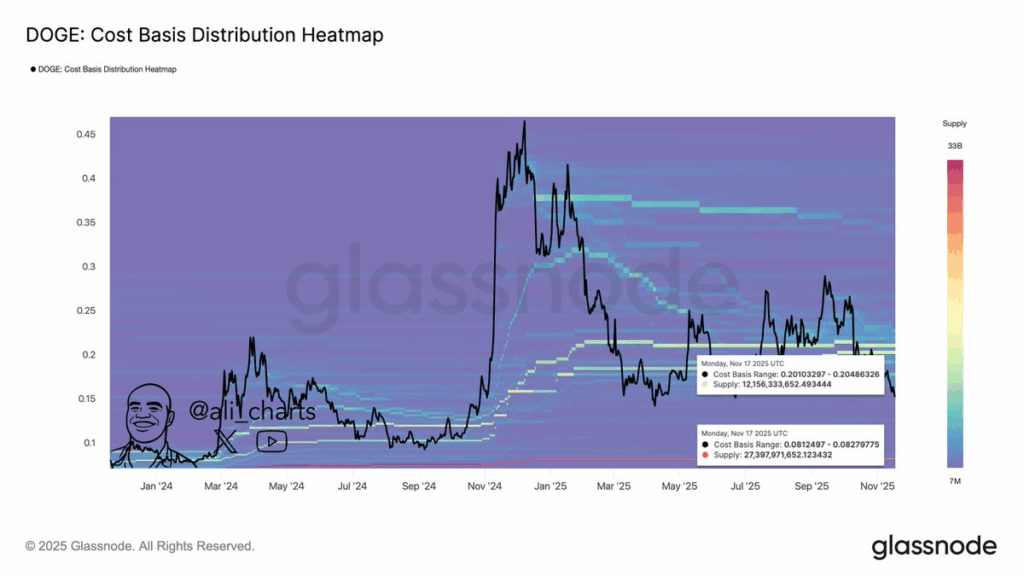
Additionally, another interesting cluster can be observed between approximately $0.201 and 0.205. This range covers approximately 12.2 billion DOGE. This is one of the territories where a significant number of addresses joined the market earlier in 2025.
The heatmap demonstrates that the Dogecoin price is moving between those two bands throughout the majority of the year. Dogecoin broke out of its bottom band near $0.08 at the end of 2024. It then rallied to highs around $0.45 before stabilizing between $0.15 and $0.30 through 2025.
Long-Term Trendline Dogecoin Price Charts Repeated Support-Driven Rebounds
Dogecoin price charts show rising support channels since 2015. Each cycle begins with price consolidation. The trend forms a gradual upward movement. Eventually, the price breaks sharply in a vertical rally.
The breakout candles that followed a long engagement with the lower line of support are highlighted on the chart. During the 20152017 scale, Dogecoin traded above a steadily increasing support level.
Then, it shot up at the beginning of 2017. The same kind of structure emerged between 2019 and early 2021. There was a notable spike towards the area of $0.70.
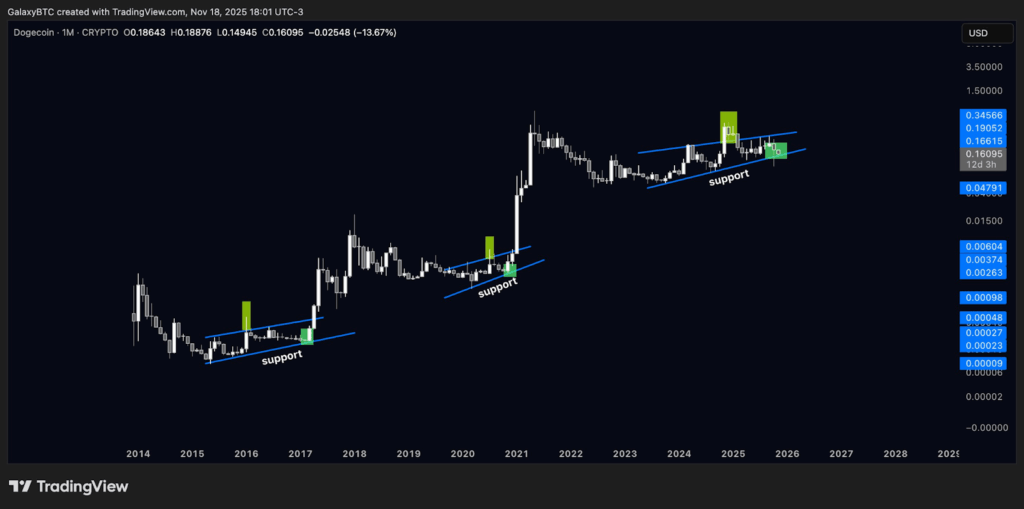
The existing channel commences approximately at the end of 2022 and runs through to 2025. The current support is on an upward trend.
However, with a near $0.05 as the support level, the price is swinging between the near support level. The resistance is at around the midpoint of 0.30 seconds.
The most recent monthly candle appears in green within the channel. The market pulled back around 0.35 earlier this year. This move placed the candle firmly inside the trend.
According to analysts, DOGE is once again at the support level. This is in line with the structure of the past, which was followed by the intense expansions.
The long-term chart does not provide targets. However, it suggests that the current level falls into a repetitive behavior. In both previous cycles, DOGE moved back to its support line, which was rising again. The meme coin subsequently moved to a new high at the end of that prolonged uptrend