astronaut
 Zylo Ecosystem
 Pearl
Pearl Sui
Sui Walrus
 Quantus
 Quant
Quant

Ethereum price was stuck below the key support level at $3,000 on Monday as the crypto market crash continued. It has now dropped by nearly 15% from its highest level this year, despite growing on-chain metrics, including soaring transaction counts and active users. ETH was trading at $2,890 on Monday, down 42% from its August 2021 high.
On-Chain Analysis Shows Ethereum Network Growth is Continuing
Data compiled by Nansen shows that Ethereum, despite its size and popularity, has become the fastest-growing chain in the crypto industry in the past few weeks.
The network’s transactions jumped by 36% in the last 30 days to over 64 million as its ecosystem continued growing after the Fusaka upgrade.
Transaction growth occurred as the number of active addresses jumped by 50% to over 14.3 million. Its daily active users on Monday were over 865,500, well above the December low of 412,250.
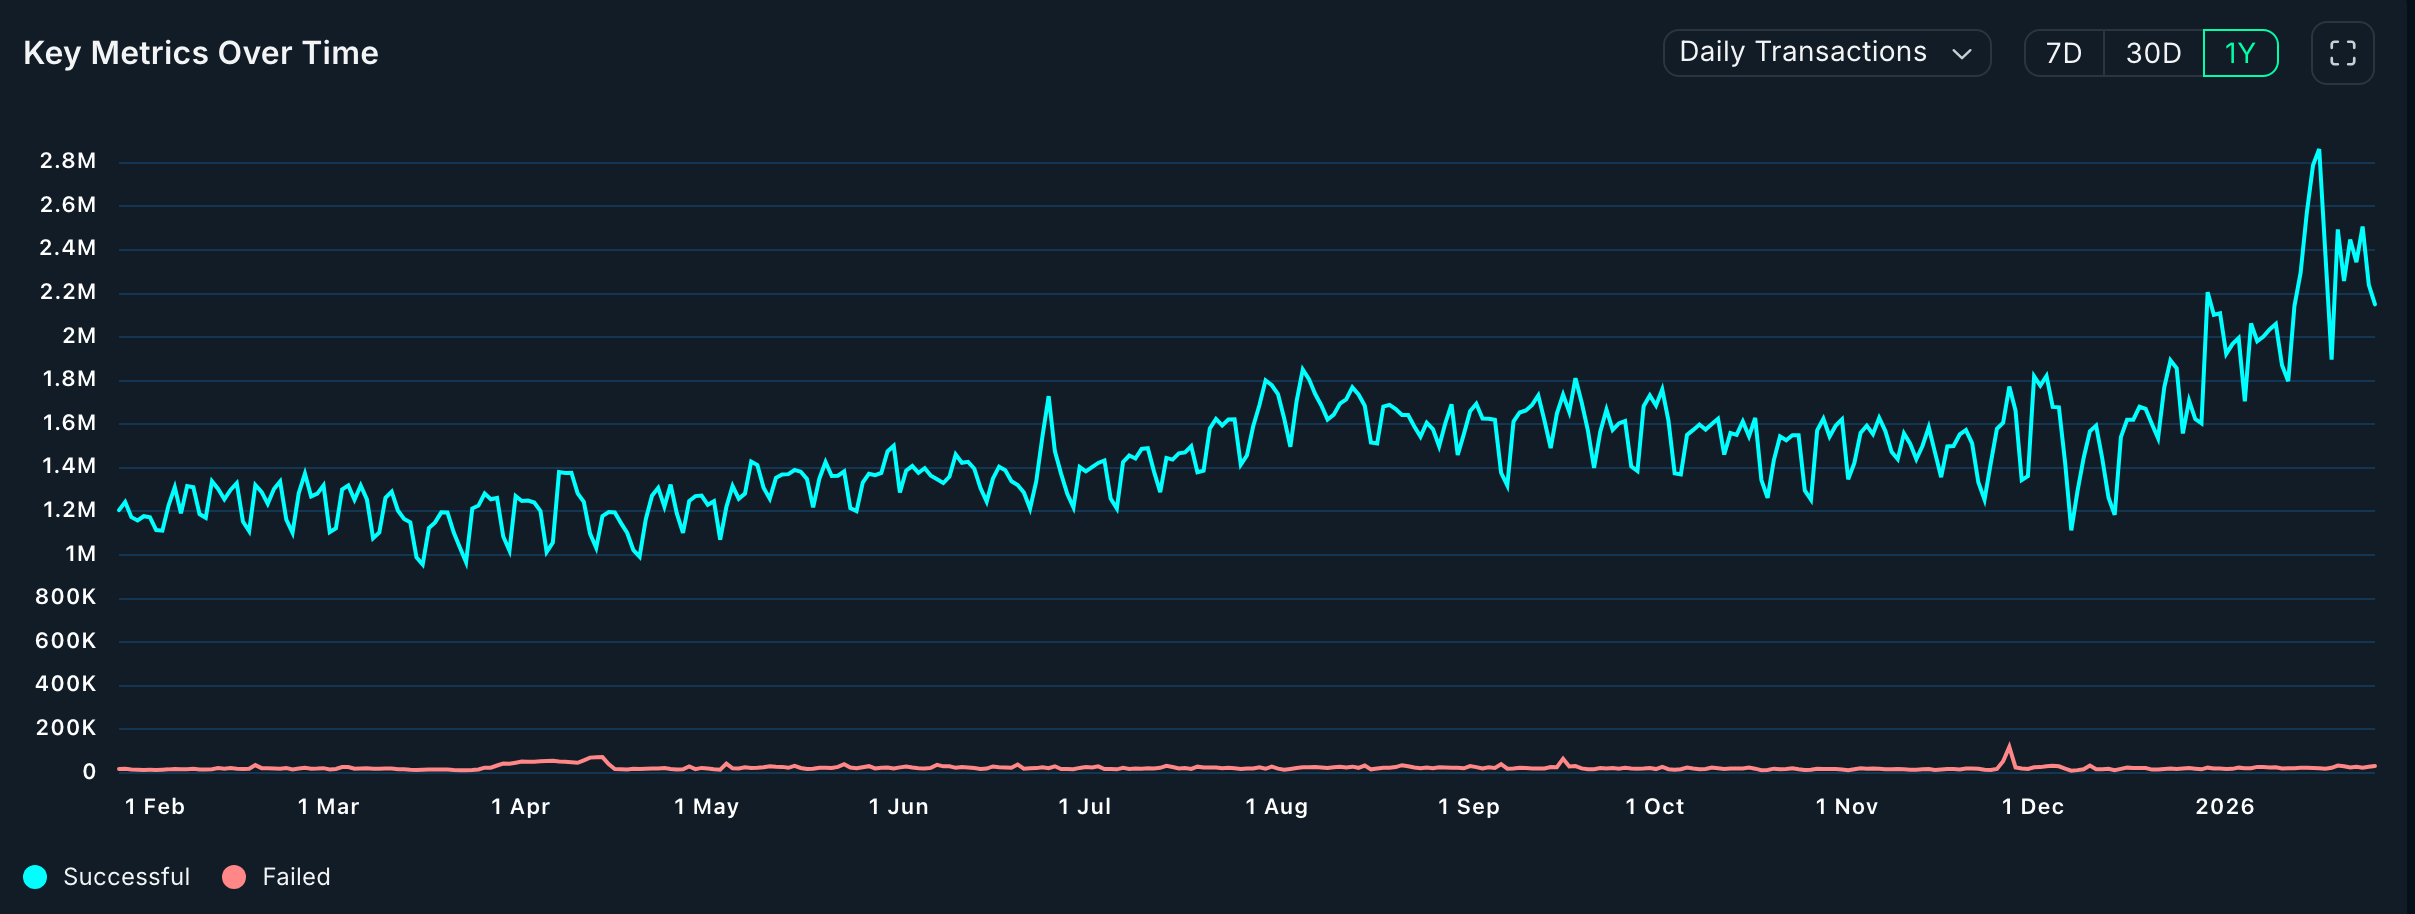
One reason this growth is happening is that Ethereum fees have continued to fall over the past few months, making it cheaper than some layer-2 networks. As such, more users are starting to leverage Ethereum’s technology to handle key transactions, reporting in the stablecoin industry.
Growing Stablecoin and RWA Market Share
Data compiled by Artemis shows that Ethereum has a leading market share in the stablecoin industry, where it has over 7.1 million active addresses. It processed over $986 billion in stablecoin transactions in the last 30 days. Most of its transactions were in Circle’s USDC followed by Tether‘s USDT. The other notable stablecoins on Ethereum are USDS and Dai.
Meanwhile, Ethereum has become the favorite chain for companies embracing the Real-World Asset (RWA) tokenization industry. Data compiled by TokenTerminal shows that Ethereum’s RWA network have over $10 billion in tokenized assets, giving it a market share of over 60%.
For example, Ethereum has over $4.5 billion of tokenized commodities, while BNB Chain, the second-biggest player in the industry has over $26 million. It also has a leading market share in the tokenized stocks and treasuries industry, as shown in the chart below.
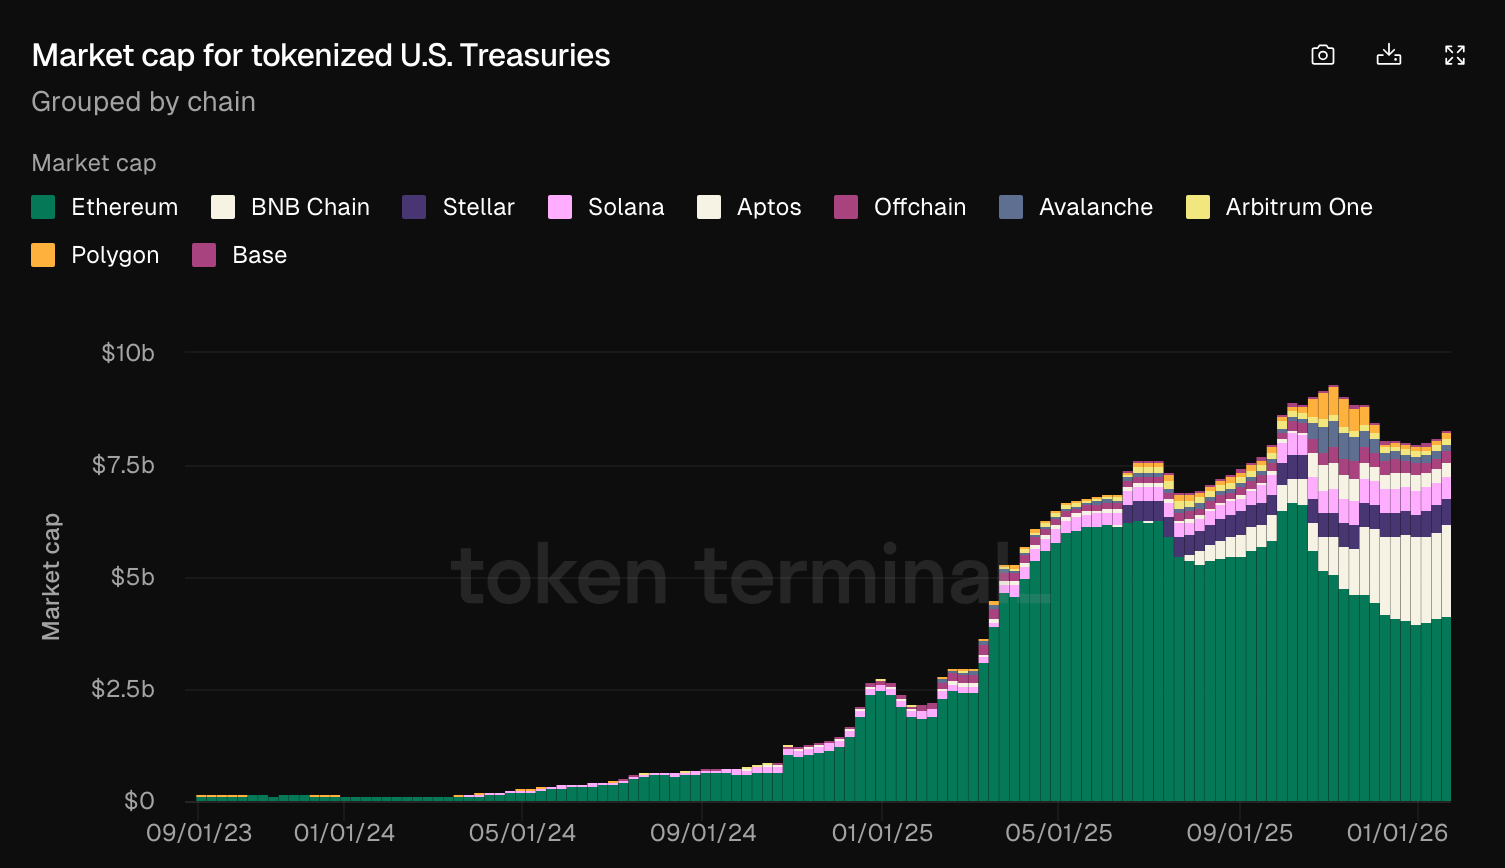
Ethereum has become the chain of choice for the world’s largest companies entering the tokenization industry. For example, the recently launched JP Morgan My OnChain Net Yield Fund (MONY) has already accumulated over $100 million in assets within less than a week.
This growth will likely continue in the foreseeable future because of the upcoming upgrades, including Glamsterdam and Hegota. Glamsterdam will introduce key concepts such as zero-knowledge proofs (ZKP) and sharding, which will enhance privacy and speed on the network.
Why Ethereum Price Crashed
ETH’s price has dropped despite ongoing ecosystem and on-chain growth due to the broader crypto market crash that has affected Bitcoin and most altcoins.
The ongoing crash is due to rising geopolitical tensions, as the US deploys warships to the Middle East and Donald Trump threatens tariffs on Canada.
It is also falling as the spot ETH ETFs continue shedding assets. They suffered millions of dollars worth of outflows last week as some investors rotated to the soaring gold and silver.
Ethereum Price Technical Analysis
The three-day chart shows that ETH price has crashed in the past few months, moving from a high of $4,950 to the current $2,865. It has fallen below both the short- and long-term Exponential Moving Averages (EMAs).
Most importantly, the coin has formed a bearish flag pattern, which happens when an asset crashes and then consolidates. It is now hovering near the lower side of the flag.
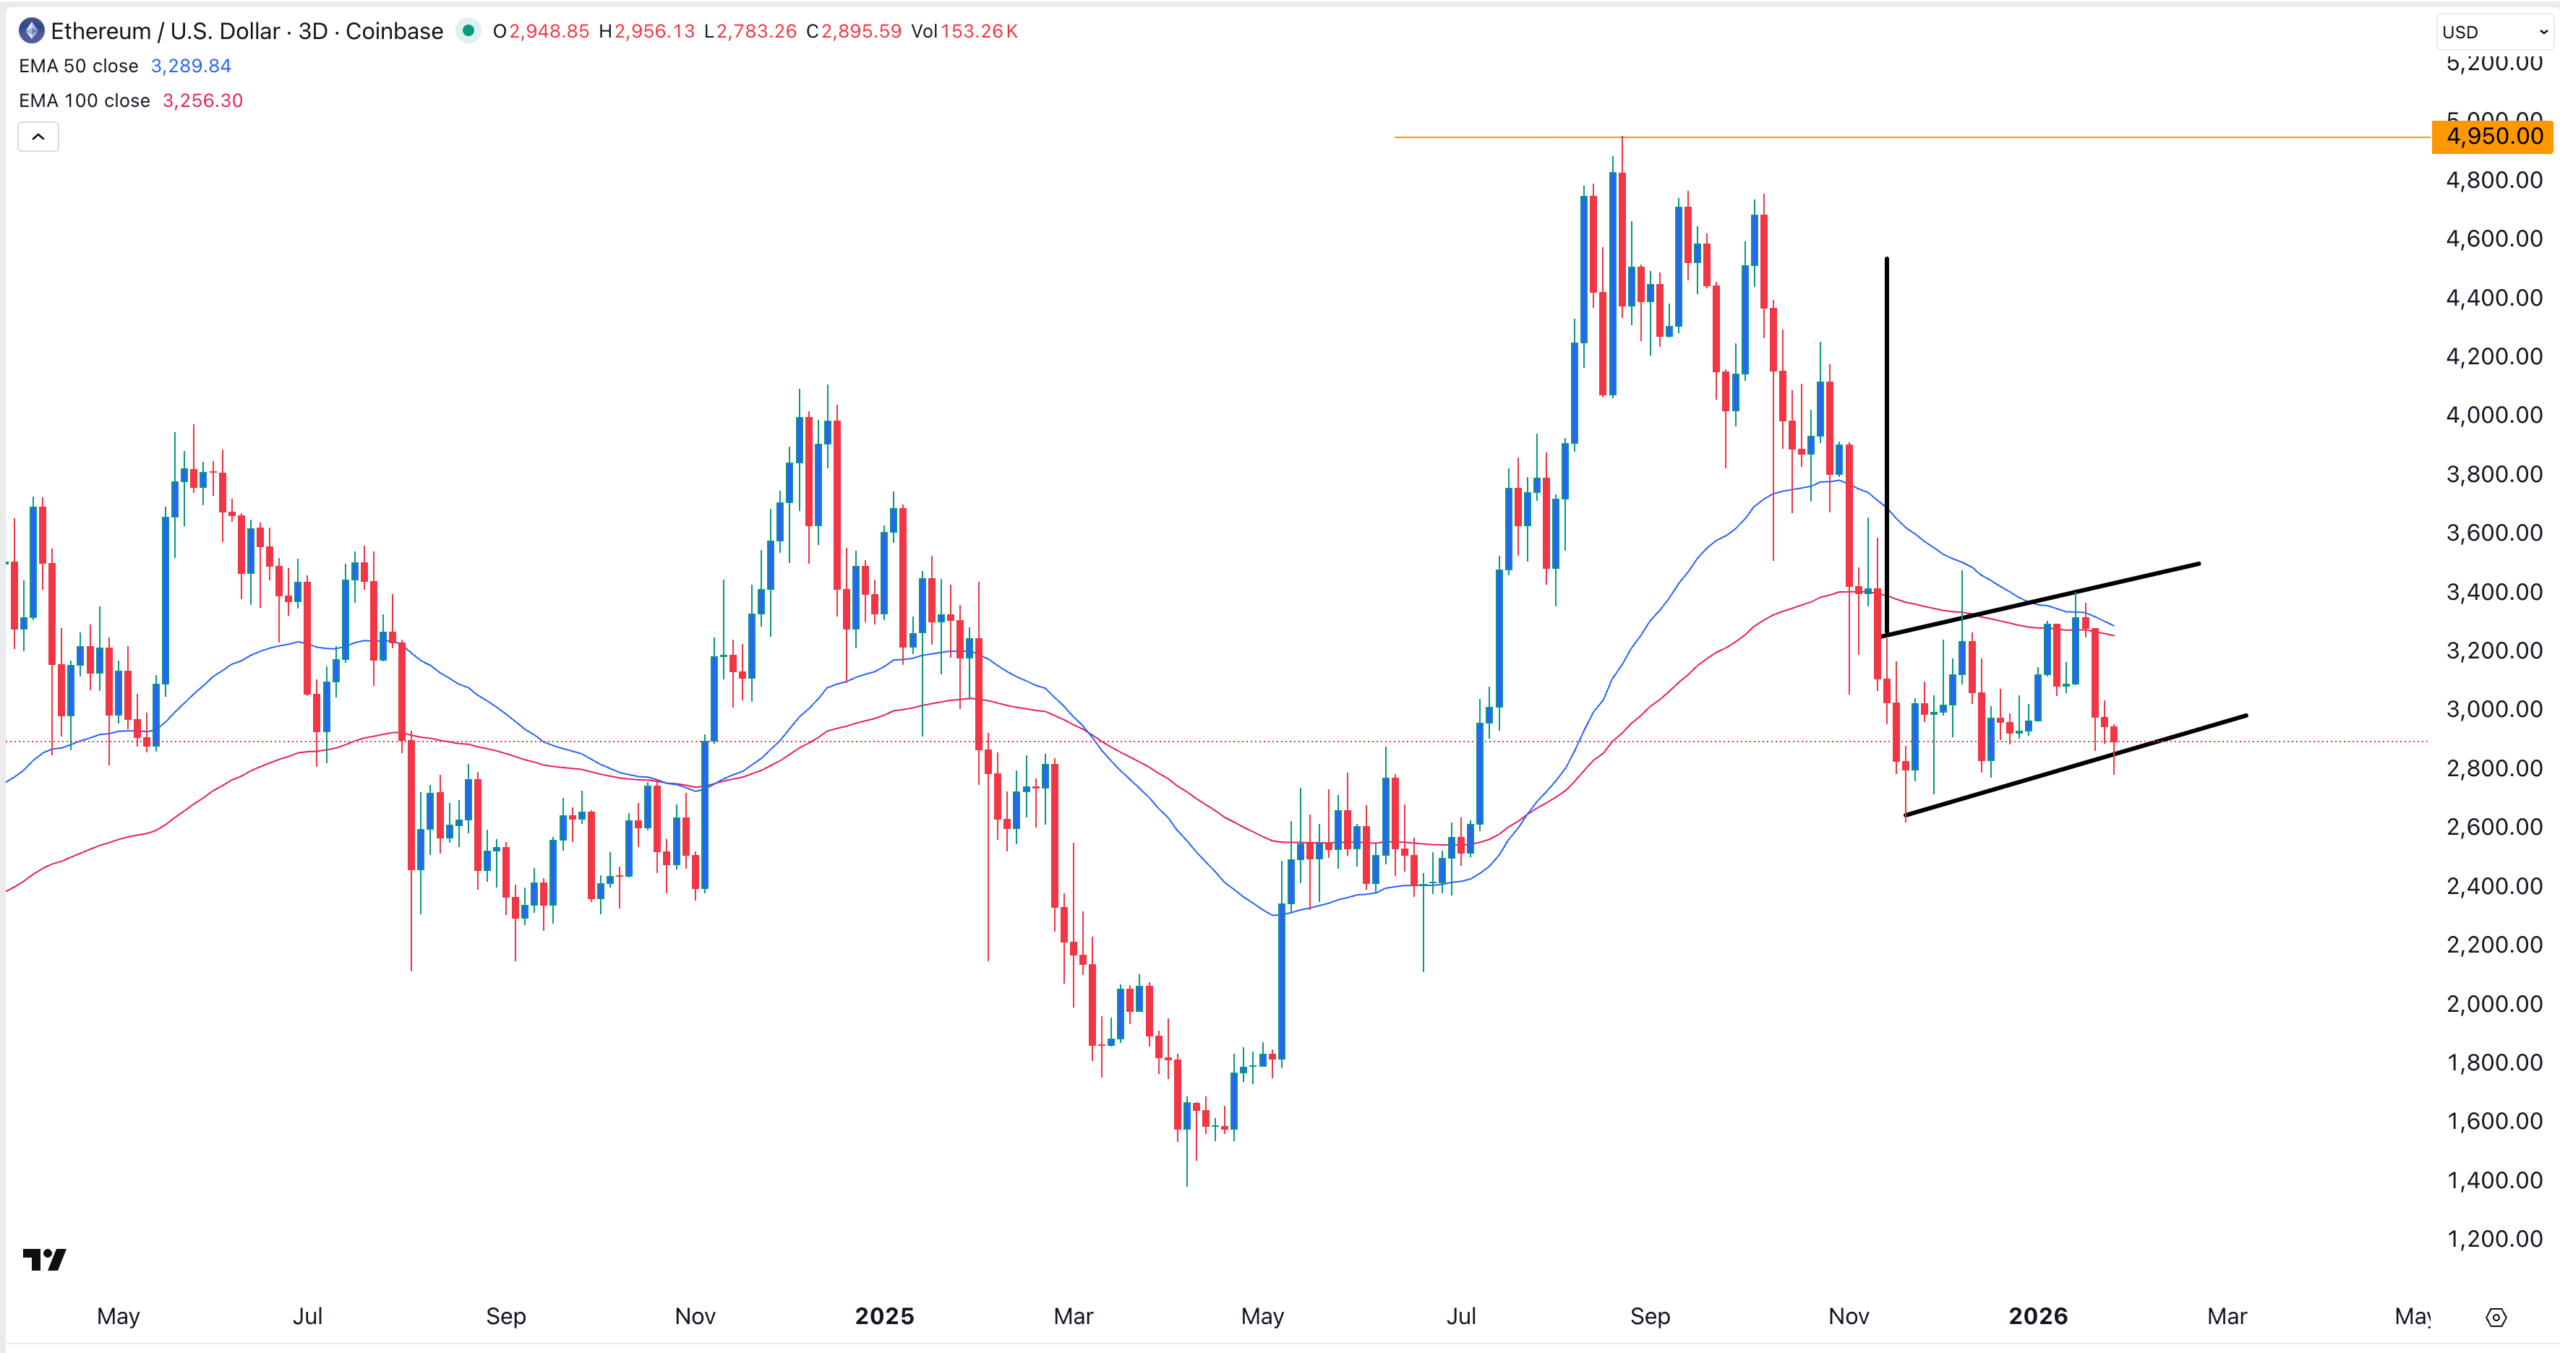
Therefore, the most likely scenario is where it has a bearish breakdown, potentially to the psychological level at $2,500. The bearish outlook will become invalid if it moves above the flag pattern’s upper boundary at $3,425.