astronaut
 Pearl
Pearl Zylo Ecosystem
 Bitcoin
 Bitway
 NEAR Protocol
 Zcash
Zcash

MSTR stock price continued its recent decline this week, reaching a crucial support level. Strategy stock dropped to a low of $240.
It’s a notable level that coincided with its lowest level in February and April this year. The stock has more downside after forming risky patterns on the daily chart.
MSTR Stock Price Technical Analysis
The daily timeframe chart shows that the Strategy stock price has been in a free fall over the past few months. After peaking at $455 in July, the stock plunged to a low of $240 today.
This decline happened after it formed a double-top pattern whose neckline was at $358, its lowest level in June. A double-top is one of the most popular bearish reversal patterns.
MSTR stock price has now formed a death cross pattern as the 50-day EMA has dropped below the 200-day average. This pattern often confirms a bearish continuation pattern, as it indicates more downward momentum.
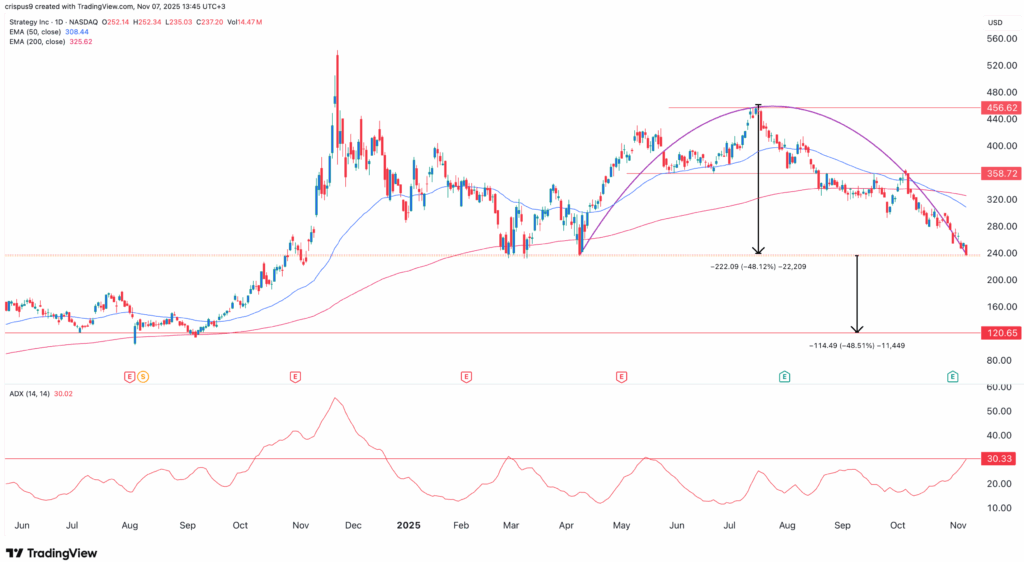
The sell-off is gaining momentum. The ADX has surged to 35, its highest level since May. A rising ADX indicator is a sign that a trend is strengthening.
Most importantly, there are signs that the stock has formed an inverse cup-and-handle pattern. This pattern features a horizontal support and a rounded top.
The distance between the upper side and the lower side of the cup is approximately 48%. Therefore, measuring the same distance from the current level points to more downside, potentially to the key point at $120.
There are other technical risks to the Strategy stock price. For example, it remains below the Supertrend indicator and the Ichimoku cloud, indicating that bears are currently in control.
Futures Market Signals That the MSTR Stock Downtrend Has More Room to Run
Meanwhile, the options market suggests that MSTR stock may continue to decline in the near term. One key data is the sentiment among options traders.
Barchart reports $240 million in bearish sentiment and $88 million in bullish sentiment. This results in a net trade sentiment of -$152 million.
Meanwhile, additional data from the options market indicates that open interest has been in a strong downward trend. It is reaching a low of 0.87 today, down from 1.18 in August.
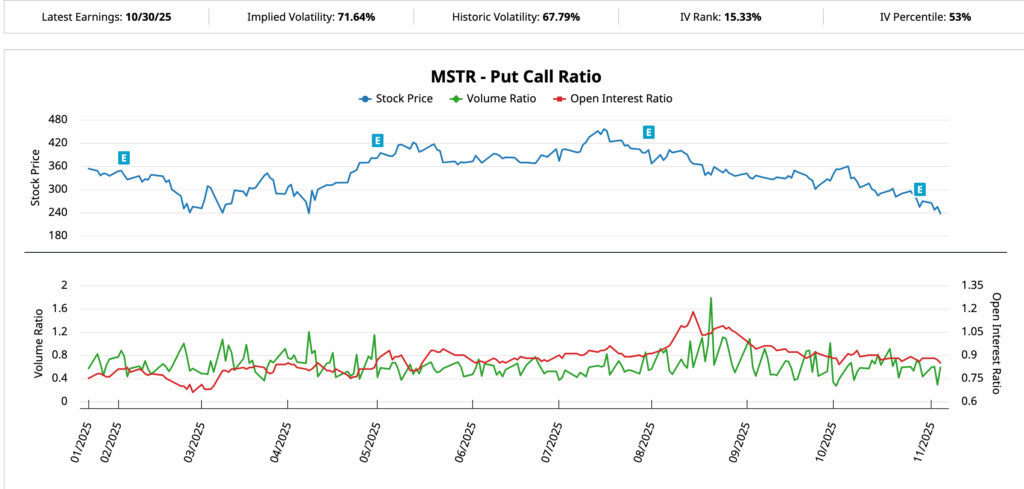
The falling open interest is a sign that traders in the options market are reducing their leverage. It is a risky thing for the company.
Bitcoin Price at Risk of More Downside
Another significant risk to the Strategy stock is Bitcoin’s sharp decline. Its price has dropped from $126,300 to $100,000.
Technical analysis suggests that the coin has more downside to go. For example, the Average Directional Index has moved to 28, a sign that the downtrend is gaining momentum.
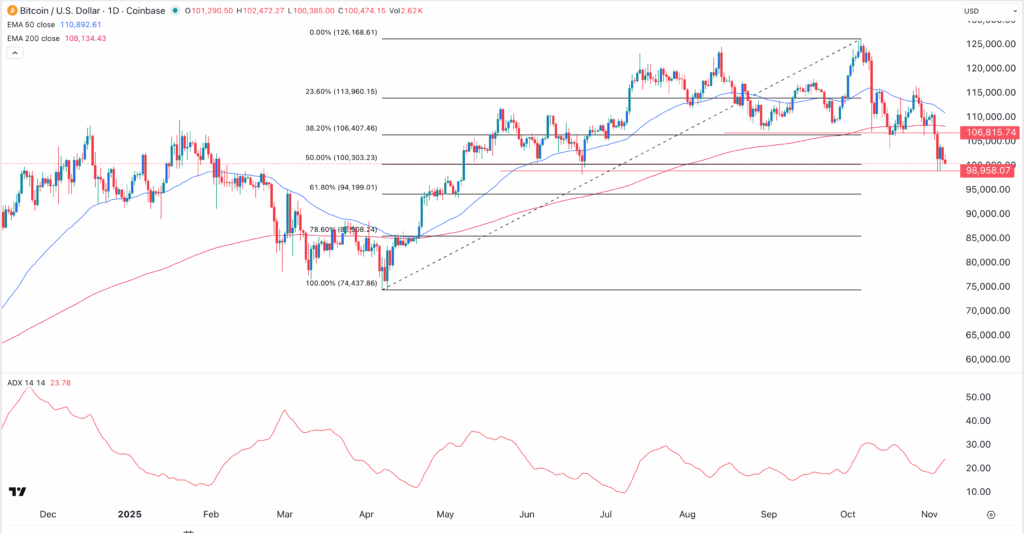
The stock has also dropped below the 50-day and 200-day EMAs. Additionally, the two are about to cross paths, a move that will likely signal further downside. It has broken below key resistance at $106,525, the lowest level reached in August. It also breached the double-top neckline at $126,170.
Therefore, the coin is likely to experience a bearish breakdown, potentially reaching the 61.8% Fibonacci Retracement level at $94,200. A move below that price will indicate further downside, which will impact the market value of Strategy’s assets.
MSTR stock price has been in a strong downward trend in the past few months. This trend will continue as investors re-rate its valuation metric. In this case, the market is simply removing the premium that existed and valuing it based on its underlying assets.
This re-rating explains why the market NAV multiple has plunged to 1.05 today, down from 3.5 in November. It also explains why other similar companies have lost their premium this year.