Wisp
Wisp Doge Pepe
 Crawlerpad
 Zylo Ecosystem
 Pearl
Pearl Basic Attention
 Quantus

The altcoin market gains renewed attention as long-term indicators align. Traders anticipate the start of Altcoin season with growing momentum.
Analysts are comparing today’s situation with periods that preceded the major altcoin expansions. The focus is shifting to dominance, ratios, and market-wide signals for accumulation.
Altcoin Season Cycle Signals a Structural Repeat
Analyst 0xklarck pointed to a long-term chart showing the total crypto market cap (excluding the top 10 assets) in relation to Bitcoin. This is a ratio that is used to measure the strength of altcoins relative to Bitcoin dominance.
According to 0xklarck, previous altcoin cycles were followed by long compression phases in this ratio. In 2016, there was a similar base followed by a forecasted 82x expansion across select altcoins.
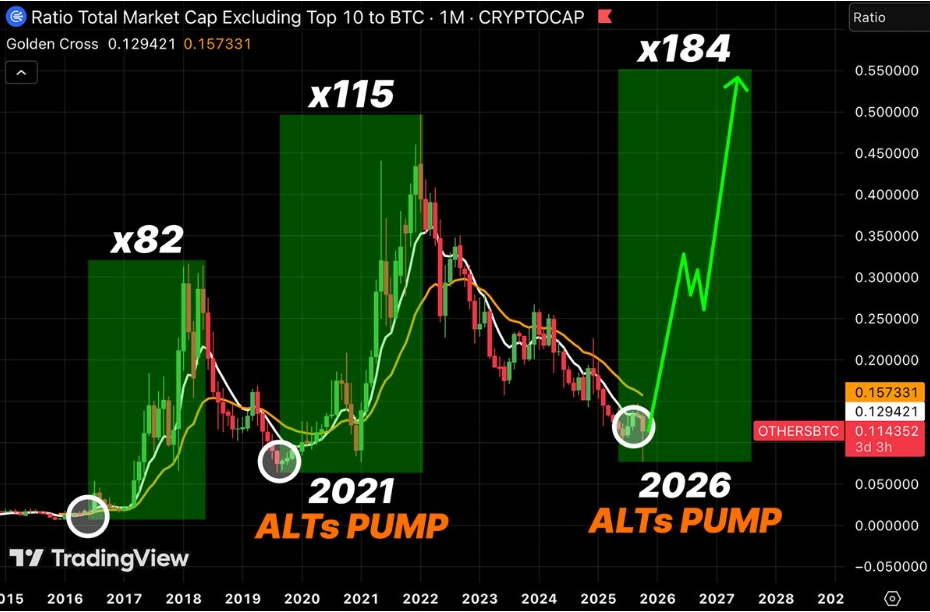
The structure of the 2021 altcoin season cycle was similar. That period brought an estimated 115x expansion in the same ratio metric.
Current charts indicate that the ratio has stabilized after a multi-year downtrend. A monthly golden cross has now appeared, which signals a trend transition.
0xklarck indicated that past golden crosses were in line with early accumulation stages. These phases were often preceded by wider market recognition.
Projection zones on the chart extend to 2026. Some speculative paths indicate expansion potential higher than previous cycles.
While projections are no guarantee, the structural repeat remains notable. The signal is market-wide and not based on individual tokens.
Bitcoin Dominance at Risk of Structural Rejection
Another indicator that is much followed is the Bitcoin dominance. Analyst Bitcoinsensus highlighted similarities between the current dominance action and 2021 patterns.
Bitcoin dominance is testing a long-term descending resistance line. This same trendline topped dominance before the altcoin season of 2021.
Bitcoinsensus pointed out that previously, dominance failed at this level. That failure initiated a massive fall below key thresholds.
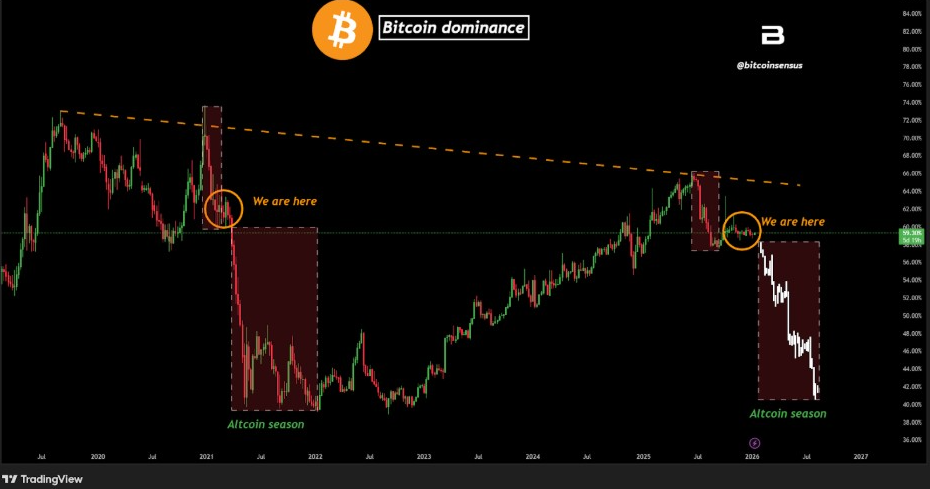
Current dominance action shows hesitation near the same zone. Momentum has flattened instead of sped up.
The analyst commented that if it broke below, 45% it would be decisive. Such a move was historically coincident with aggressive altcoin rallies.
The chart also has a “we are here” zone. This area resembles the early stages of the former dominance drop. For now, dominance is still high. Confirmation still requires follow-through and lower highs.
Altcoin Market Structure Reveals Long-Term Accumulation
Beyond ratios and dominance, the total altcoin market cap offers further insight. Analyst elcryptoprof comparing the current structure with previous accumulating phases.
The weekly altcoin market cap chart has marked higher lows since 2022. This pattern indicates constant accumulation rather than distribution.
Analyst elcryptoprof pointed out the similarities to the 2016-2017 and 2019-2020 setups. Both periods had prolonged consolidation preceding impulsive breakouts.
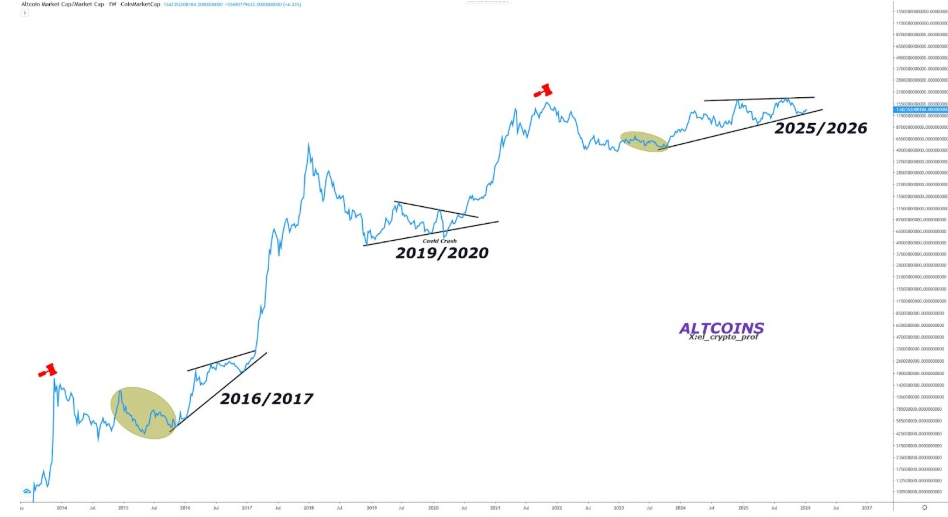
In each case, price action respected rising trend support. Break-outs occurred after sustained compression.
The current structure is still in an upward channel. Recent pullbacks have been held above significant trend lines. This behavior makes it less likely that a full trend reset will occur. Instead, it prefers gradual growth over time.
Sentiment Indicators Lag Despite Structural Strength
Interestingly, sentiment indicators are not yet at the euphoric levels. The Altcoin Season Index is still far from historical peaks. Current readings at 26 indicated that Bitcoin dominance conditions continue. In previous cycles, altcoin rallies have started with still muted sentiment.
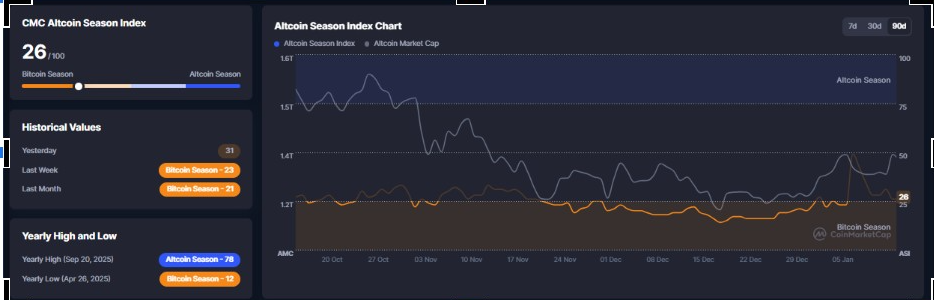
This lag was often due to disbelief in early phases of rotation. Only much later did sentiment gain momentum when prices were expanding.
A possible explanation, according to traders, is that there is usually a lack of enthusiasm appearing late. Early phases tend to reward positioning instead of momentum chasing, suggesting the market has not priced in potential rotation.