Pearl
Pearl Zylo Ecosystem
 Sui
Sui Starknet
 Pons
Pons NEAR Protocol
 Quantus

XRP price is within the $2 zone, from an extended consolidation structure in macro timeframes. Compression after a corrective wave movement is evident in price behavior. Analysts noted structural symmetry, reflecting past expansion cycles and increased liquidity activity. XRP price is positioned within a breakout structure that is reinforced by technical and on-chain indicators.
XRP Price Mirrors 2017 Fractal Expansion Setup
According to analyst Crypto Whale, the macro chart compares XRP’s 2017 cycle with the current structure. The analysis overlays Elliott-style wave labeling across both periods. Historical price action shows a completed base preceding a vertical expansion phase. The structure shows a completed Wave (4) near the $2 zone.

Both cycles exhibit rounded accumulation patterns followed by impulsive expansion stages. The chart shows that volatility decreased before a final liquidity sweep below support. This trend historically indicated cycle lows before the price began to pick up rapidly. XRP price is showing similar compression patterns before previous breakouts.
Moreover, the projected expansion zone mirrors the 2017 parabolic leg structurally. That historical move produced a multi-thousand-percent rally after consolidation was completed. The model suggests supply vacuum conditions could emerge once prior highs break. As long as the Wave (4) low holds, the macro fractal framework remains structurally intact.
In addition, consolidation behavior across both cycles shows comparable time and volatility compression. This symmetry suggests accumulation rather than distribution across higher timeframes. Structural alignment across cycles suggests the current price action is poised for an expansion.
Symmetrical Triangle Breakout Frames XRP Price Path
Meanwhile, analyst EGRAG CRYPTO presented a long-term symmetrical triangle spanning XRP’s post-2017 consolidation period. Price has respected converging trendlines across multiple years. This structure shows a prolonged volatility compression that is approaching its apex.
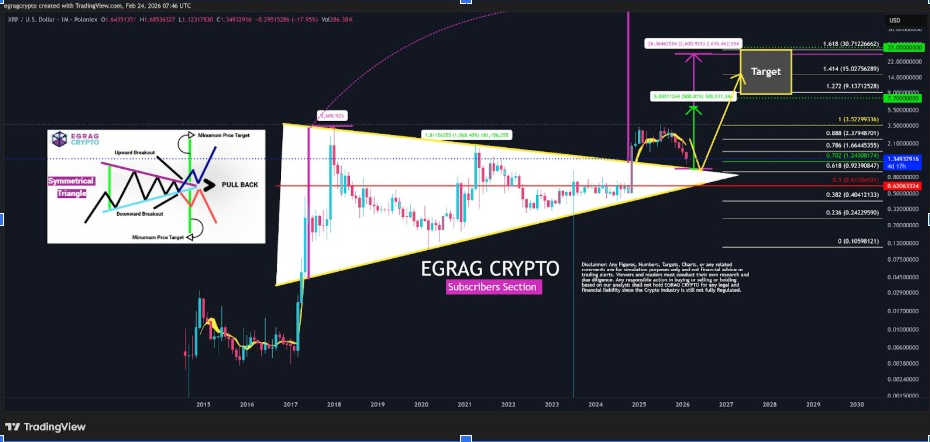
The chart shows XRP initiating a breakout above the upper boundary. A measured impulse followed by a throwback retest defines the current phase. This retest tests former resistance as structural support. Successful confirmation typically precedes the strongest phase of expansion within triangle breakouts.
Furthermore, the Fibonacci projection points to staged resistance levels within extension zones. The zone relates to the 1.618-1.888 range extensions. In the past, the levels coincided with late-cycle expansion peaks in crypto markets. XRP price structure suggests that the movement will be sequential as opposed to a vertical spike.
Also, the model contextualizes XRP price prediction in a generational foundation stretching toward long-term growth. The breakout from the structure signals a trend change. More so, price behavior indicates a shift from accumulation to macro expansion. This setup shows that Ripple price is within a structured long-cycle movement.
Additionally, time extension projections show expansion potential extending toward the next cycle phase. The structure reflects energy buildup after an extended consolidation. Price interaction with former resistance remains technically significant.
Liquidity Surge Supports Structural Expansion
In the meantime, on-chain data shared by analyst Steph Is Crypto indicates that the amount of Automated Market Maker (AMM) deposits is rising sharply. In early 2026, XRP liquidity pools registered more than 14,000 units. This influx followed months of fairly consistent levels of investor activity. The shift represents capital distribution into the ecosystem infrastructure.
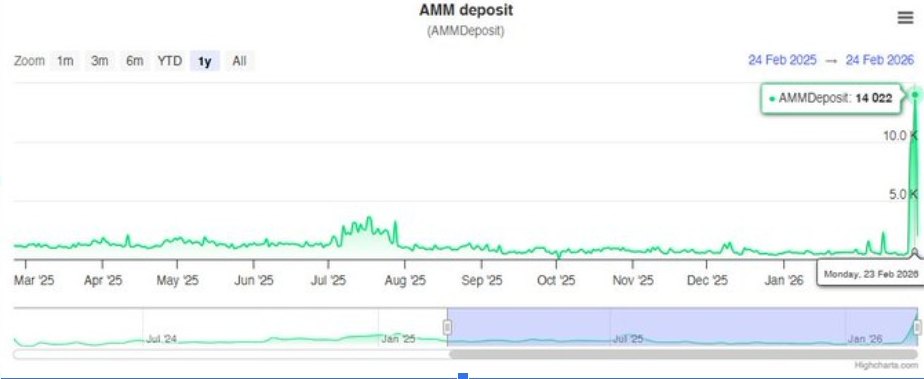
Liquidity provisioning grows when investors expect continued trading activities. Increasing deposits increases market depth and transaction efficiency. This behavior comes with an increase in the use of network measurements. XRP price prediction suggests consistency between structural breakout indications and liquidity growth.
Moreover, the growth in deposits follows a long period of consolidation. Stages of volatility expansion are often preceded by such sudden changes. These structural changes reflect behavioral adjustments among capital allocators. The token shows synchronized development across technical and network dimensions.
In addition, expanding decentralized liquidity suggests growing utility-driven participation rather than speculative concentration. Increased trading infrastructure supports broader market engagement.