
 Doge Pepe
 Zylo Ecosystem
 Crawlerpad
 Pearl
Pearl Quantus
 Starknet
 Quant
Quant
- The top 10 holders of the DYDX crypto hold 87.35% of the supply.
- DYDX’s trading volume has advanced by 8.4% in the last 24 hours.
The price sentiment for DYDX is bearish. The fear and greed index was at 31 indicating investors are afraid. Also, the token’s price was highly volatile resulting in a volatility of 13.50%.
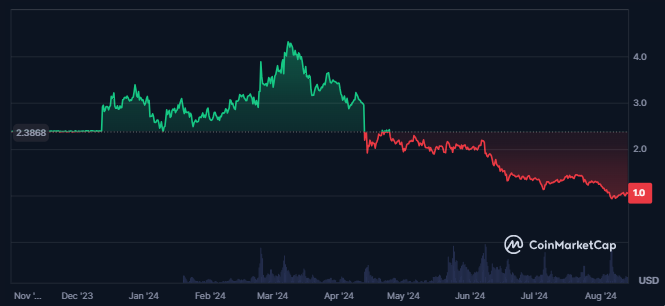
The market cap dominance of the DYDX token was 0.03% with a market cap of $650.6 Million. It is 87th largest cryptocurrency in the global crypto market. Also, in the last 24 hours, a surge of 2.3% in the token’s market cap was recorded.
Additionally, the value of the traded volume for the token advanced by 10.5% following the surge in market cap. The value of the traded volume for the token was $16.429 Million which resulted in a volume/market cap ratio of 2.49%.
The circulating supply of the token further was 620.220M DYDX which was followed by a total supply of 771.541M DYDX. This was followed by a maximum supply of 1.0B DYDX resulting in a fully diluted market cap of $805.866 Million.
The token is traded 76% below its all-time high price of $4.53 which was marked five months ago. Eight days ago, an all-time low of $0.8475 was formed and the price since then advanced by only 24%.
DYDX Token Fundamental Data Overview
DYDX had a total of 56.9K holders and a surge in the total number of token holders was recorded over the last few months. Also, the largest holding address of the token alone held 54.51% of the total supply.
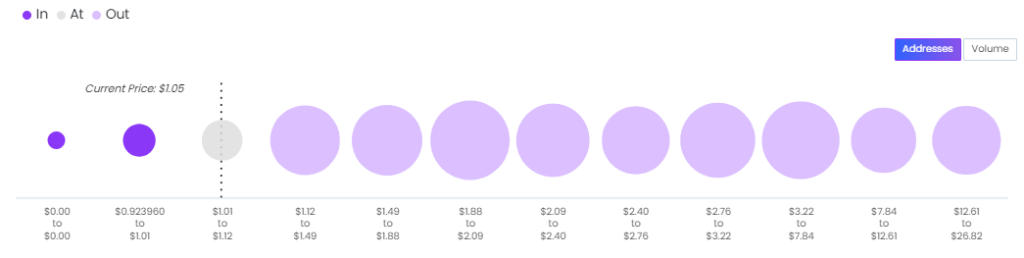
The large holders concentration of the DYDX token was 93% and only 2% of the token holders were in profit. 97% of the holders were in loss and 54% of the holders have held it for more than 1 year.
Despite this, a decline of 19.3% in the net deposits of the token was recorded in the last 30 days. This resulted in a net deposit value of $242.27 Million followed by the 10% rise in the token’s revenue.
DYDX Token Technical Analysis
DYDX consistently declined over the last few months and took support at the dynamic trendline.
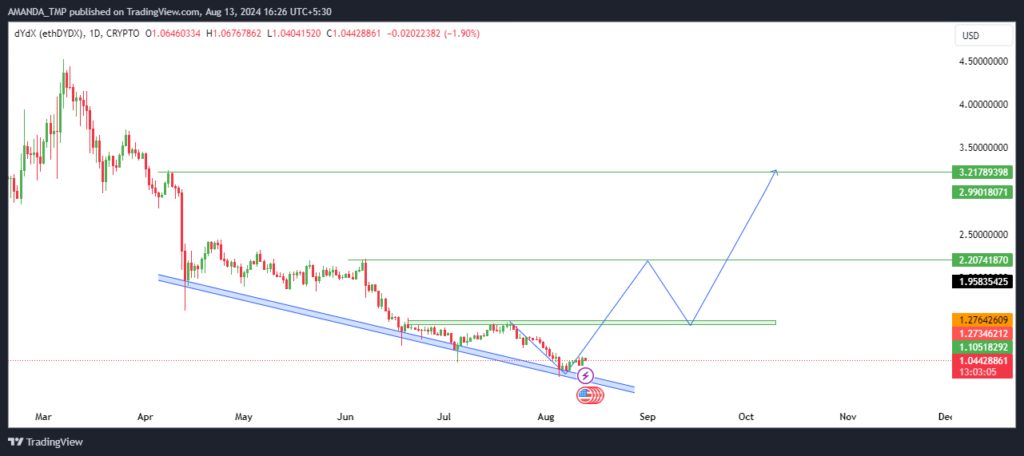
On March 07th, 2024, DYDX formed a swing high at $4.52, and the price since then started to witness profit booking. The price further declined by 80% in the five months and hit a swing low of $0.845 which was followed by an all-time low.
Additionally, a swing high of $1.50 was formed which could act as a strong change of character levels to bullish. If the token price breaks above the same level, we might get to see a bullish trend.
DYDX Token Technical Indicator Analysis
The 50-day and the 200-day EMAs traded in a death cross following which, the token traded below the EMAs for a long time,
DYDX/USD Chart by TradingView
The MACD and the signal line traded in a negative trajectory and overlapped exhibiting uncertainty. This was followed by the formation of uncertain histograms on the chart.
The RSI followed a bearish cycle and hit an oversold zone a few days ago. Additionally, at press time, the RSI traded at 41.1. The support levels for DYDX were $0.50 and $0.830, followed by the resistance levels at $2.20 and $3.20.
Disclaimer
This article is for informational purposes only and does not provide any financial, investment, or other advice. The author or any people mentioned in this article are not responsible for any financial loss that may occur from investing in or trading. Please do your research before making any financial decisions.




